I. Please check the new version of the analysis video tutorial of Business Staff: https://university.aliexpress.com/course/detail.htm? spm=a2g1d.9191980.0.0.6bd1567bKQwxR6&code=PX357VDV
II. The key pictures and texts of the new version of the business staff are explained as follows:
1. Menu fusion
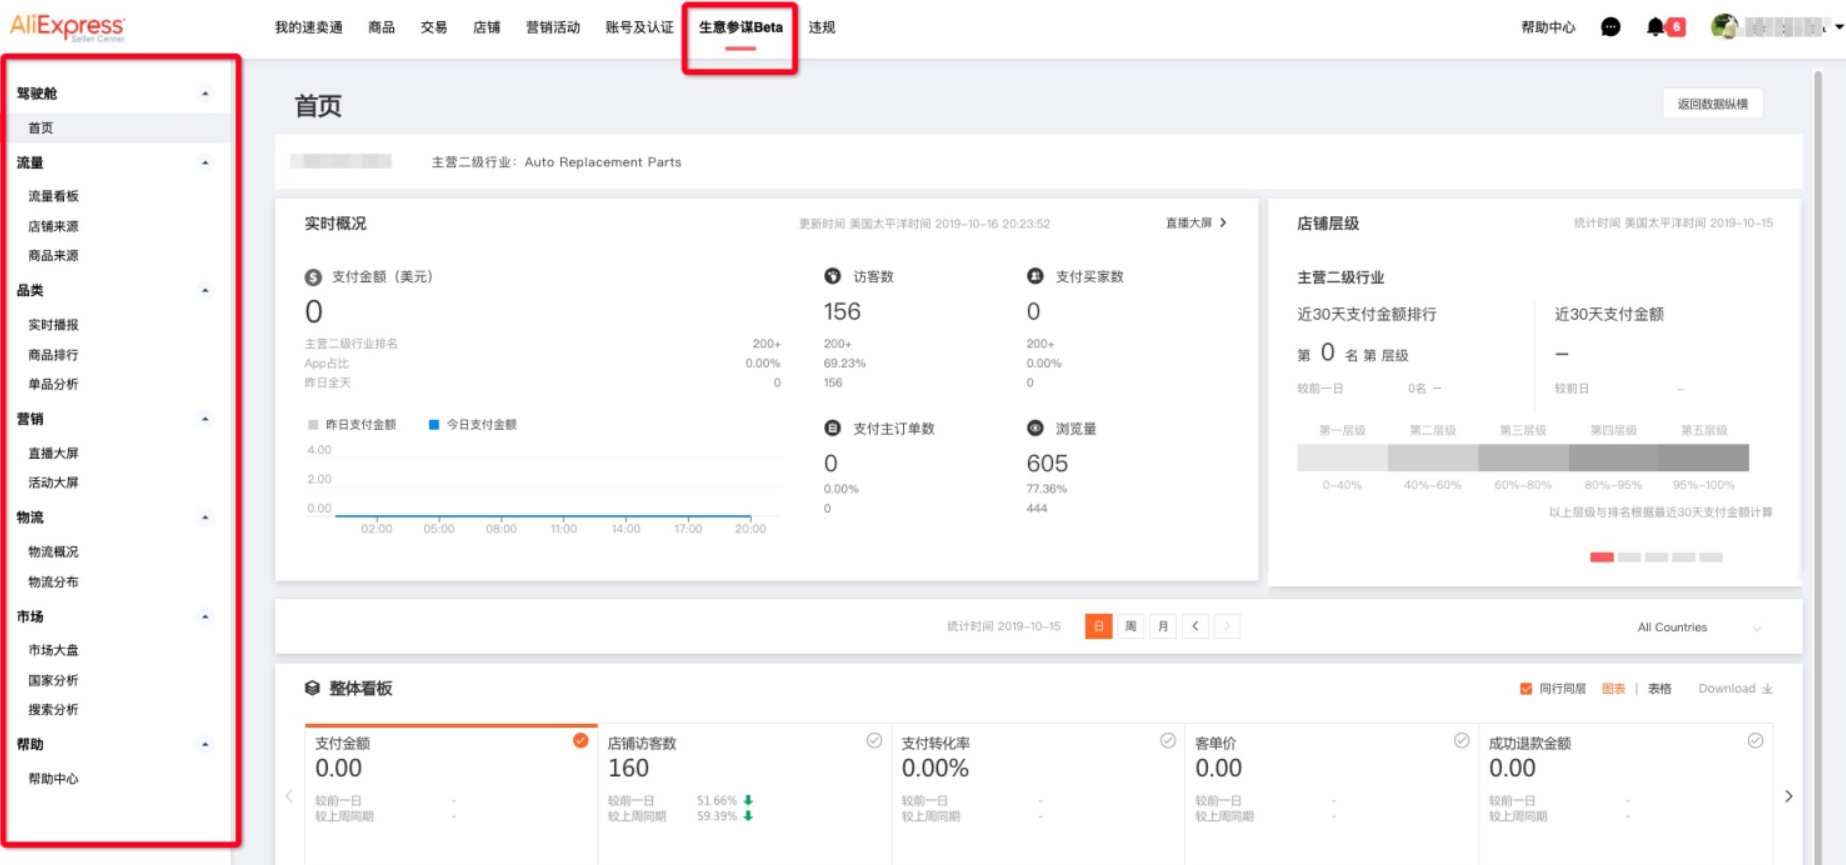
1.1 After the launch of the new version of Business Staff, it will replace the first-level menu location of data.
After the merchant enters the merchant's background, he will directly see the business staff. The menu structure is shown in the figure below, which will also be different from the old version of the business staff. The reason why it is different from the old version: the menu structure of the whole merchant background remains unified.
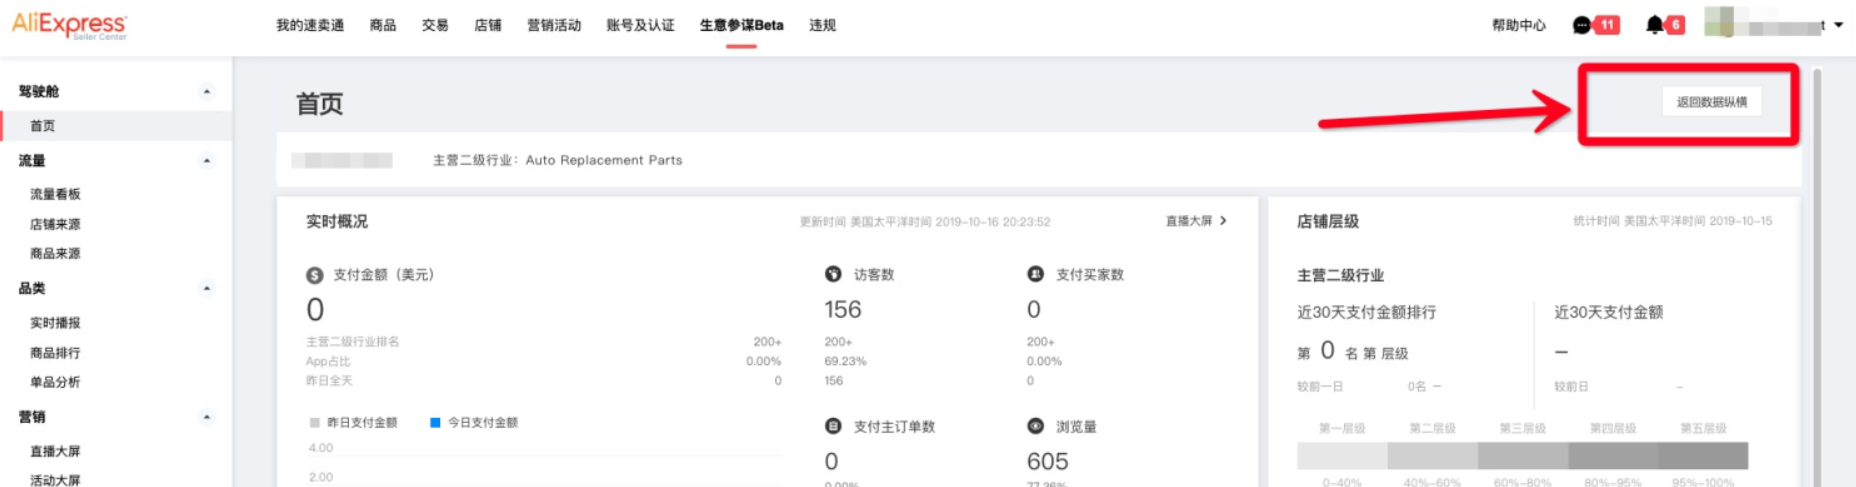
1.2 Data vertical and horizontal is not offline. In the upper right corner of each page of the business staff officer, there is still an entrance to [Return Data Vertical and Horizontal].
The platform will continuously optimize the section and functions of business staff, and the offline data will be horizontal after the business staff functions are relatively comprehensive and perfect. The specific replacement time depends on the progress of the project development.
2. homepage
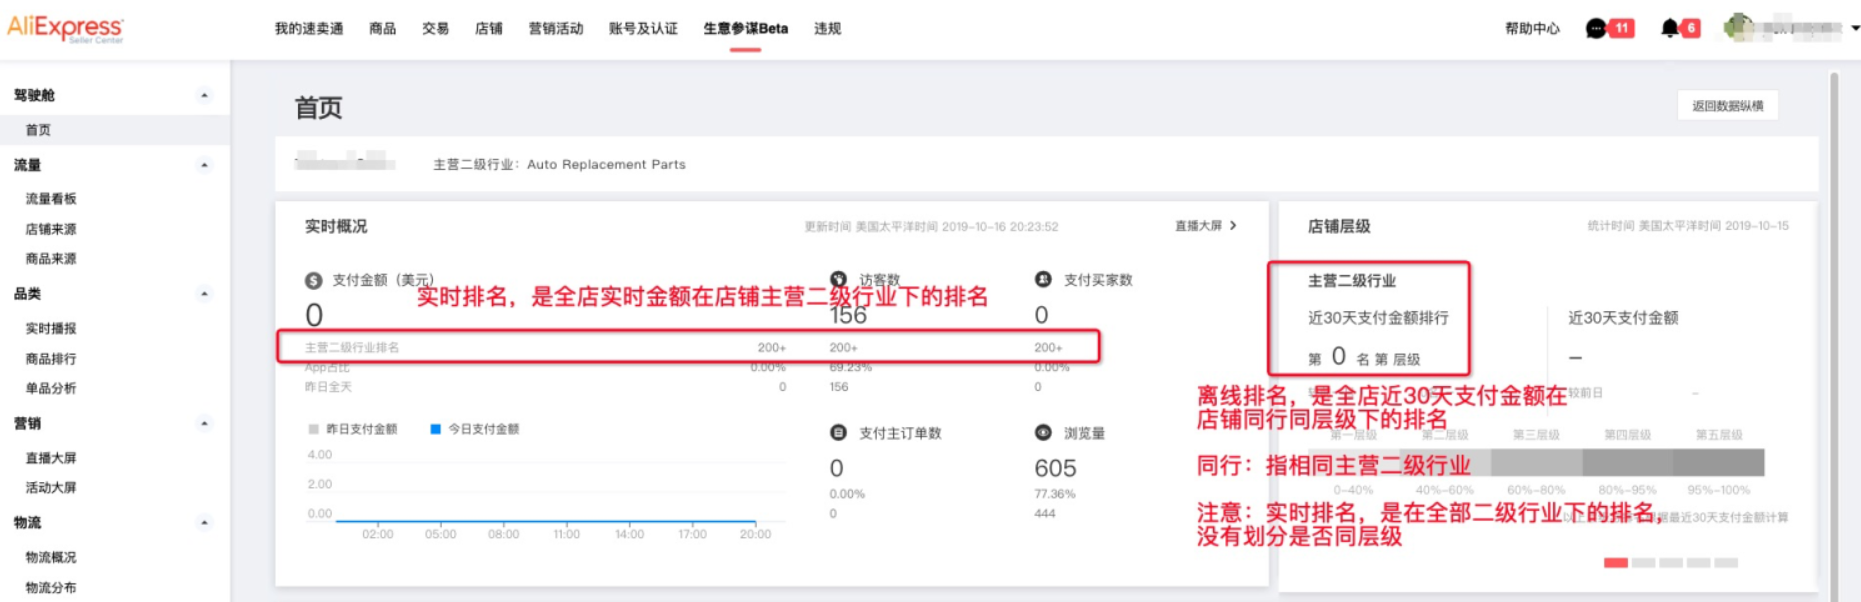
2.1 For a description of ranking, see the figure below
The data below the three indicators of payment amount, number of visitors and number of buyers paid represent: the value of the indicator, the ranking of the main secondary industries, the proportion of APP, and yesterday's all-day data.
The following data of the two indicators of payment master orders and views represent: the value of the indicator, the proportion of APP, and yesterday's all-day data.
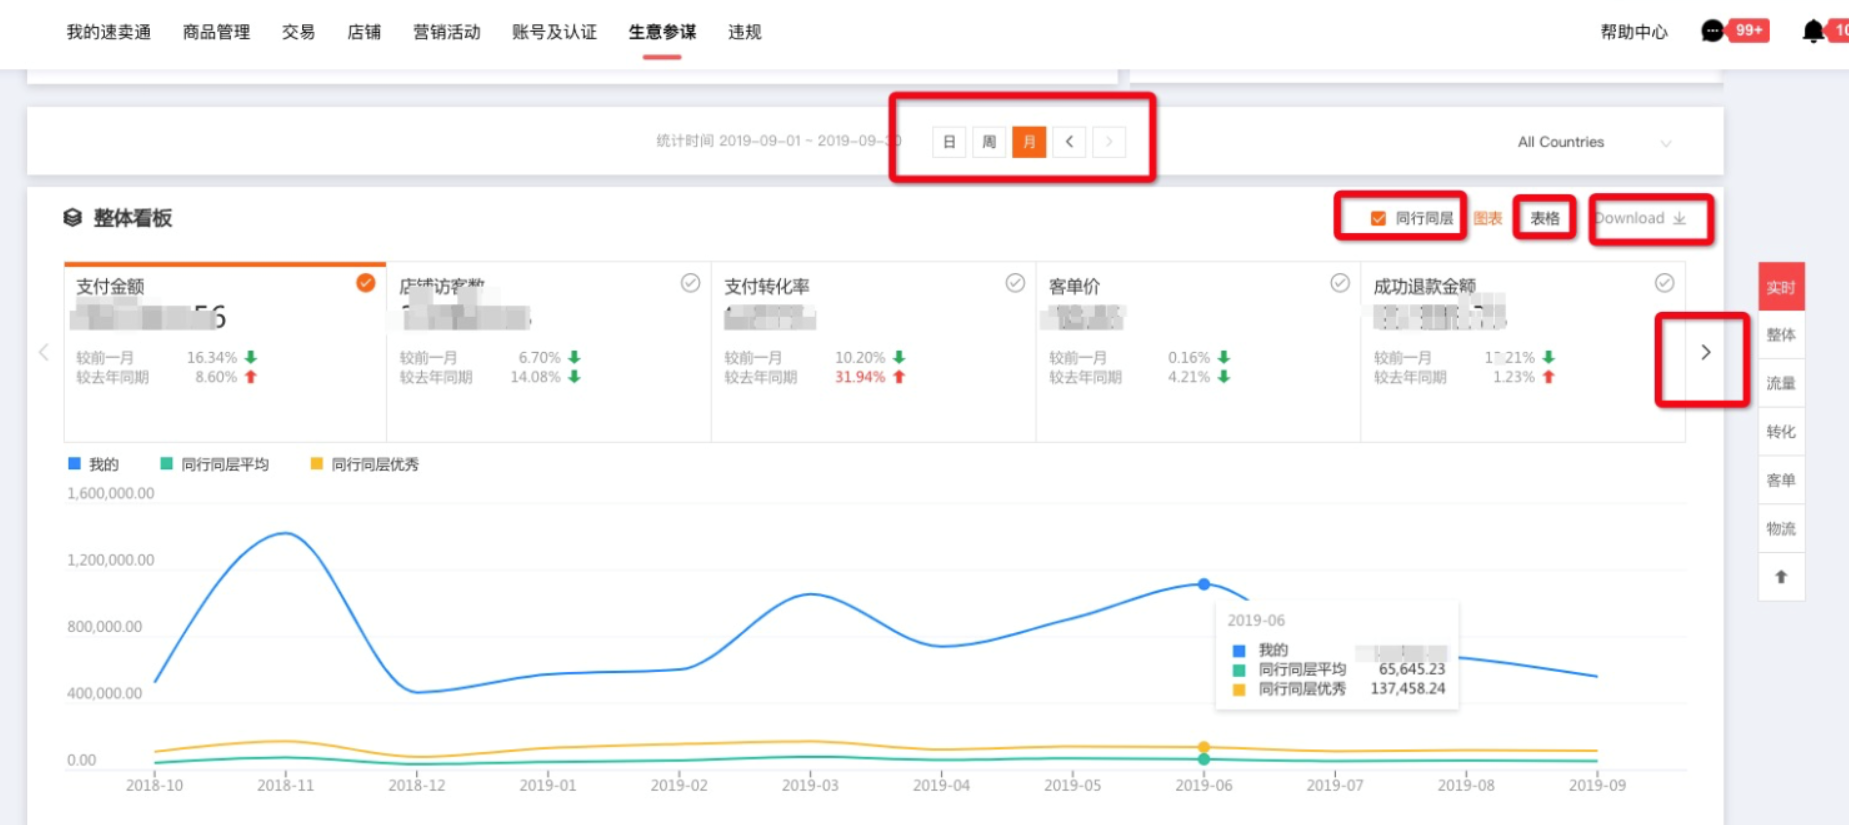
2.2 Overall Kanban
2.2.1 After switching between days, weeks and months, the trend chart is the trend chart of days, weeks and months respectively, which is different from the horizontal and horizontal data. The vertical and horizontal data is only the daily trend chart.
2.2.2 After the check of peers at the same level is removed, the following indicators can be selected more.
2.2.3 Switch to the table, and the trend chart will become a table, which is convenient for merchants to view data.
2.2.4 Provide download function
2.2.5 Indicators can be switched, providing a total of 20 core indicators
2.2.6 Data saving time: The data of the last 13 months will be retained. It is recommended that merchants download historical data to save regularly every month.
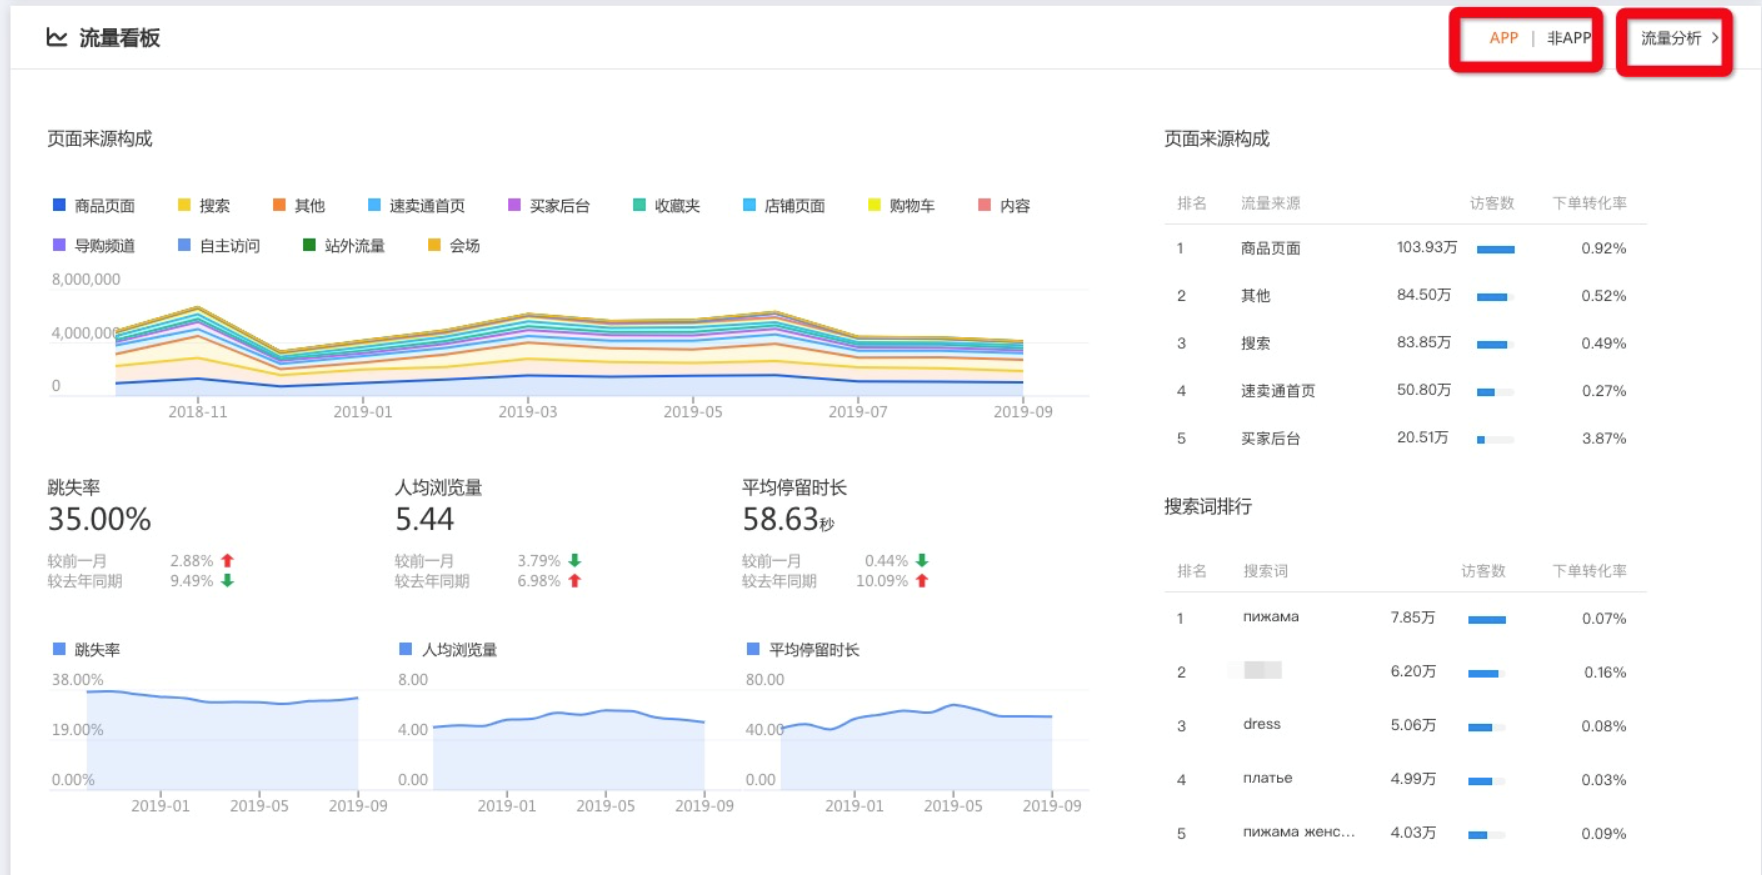
2.3 Traffic Kanban
2.3.1 You must switch between APP and non-APP to have traffic source analysis, because the source of app and non-app is different and cannot be added directly.
2.3.2 Click on the traffic analysis to jump to the traffic analysis page
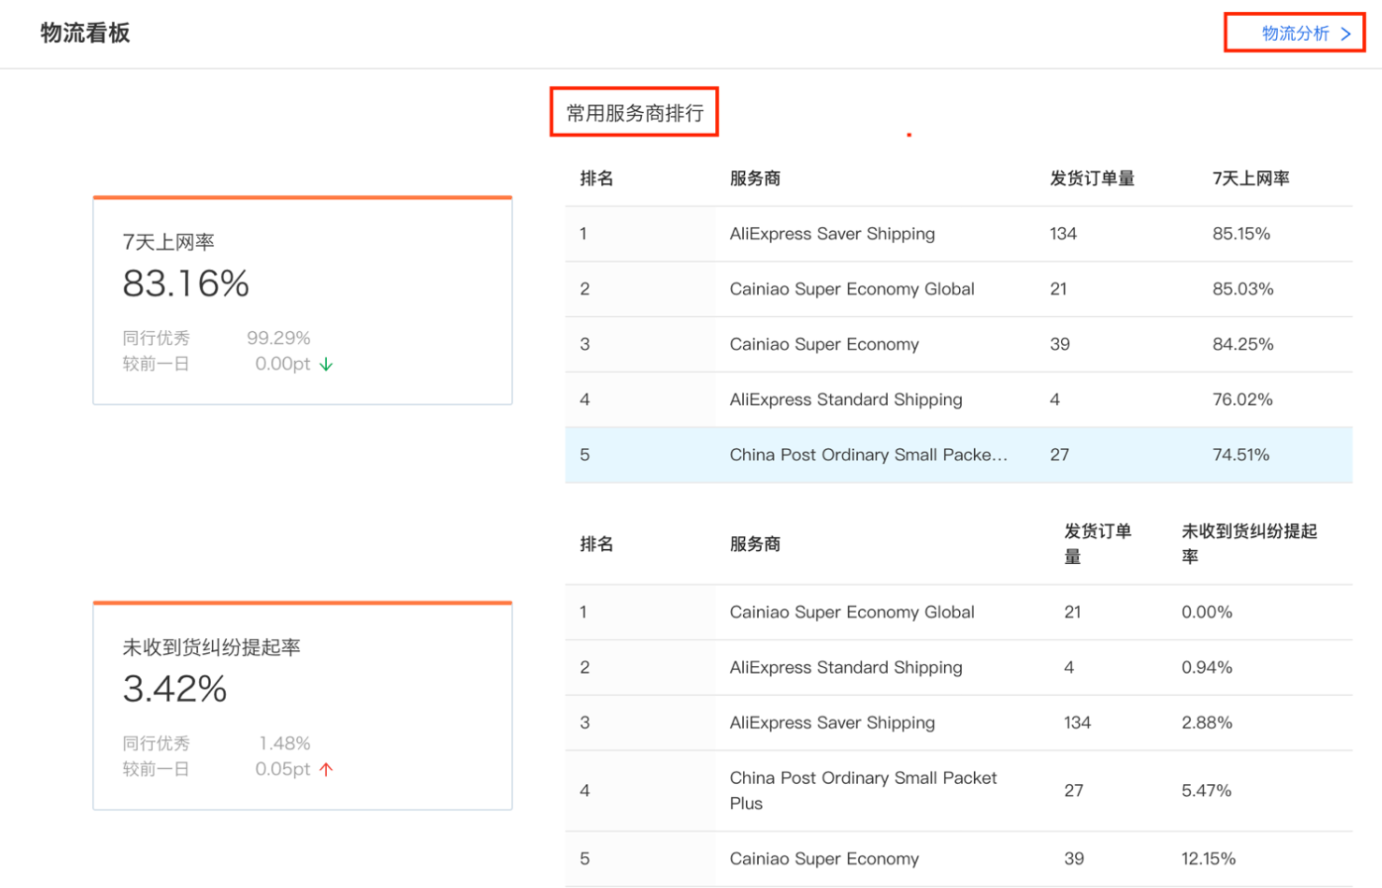
2.4 Logistics Kanban
2.4.1 Common service providers choose the top five merchants with the largest shipment volume, and then give rankings according to different assessment indicators.
2.4.2 Click Logistics Analysis to jump to the Logistics Overview page
3. flow
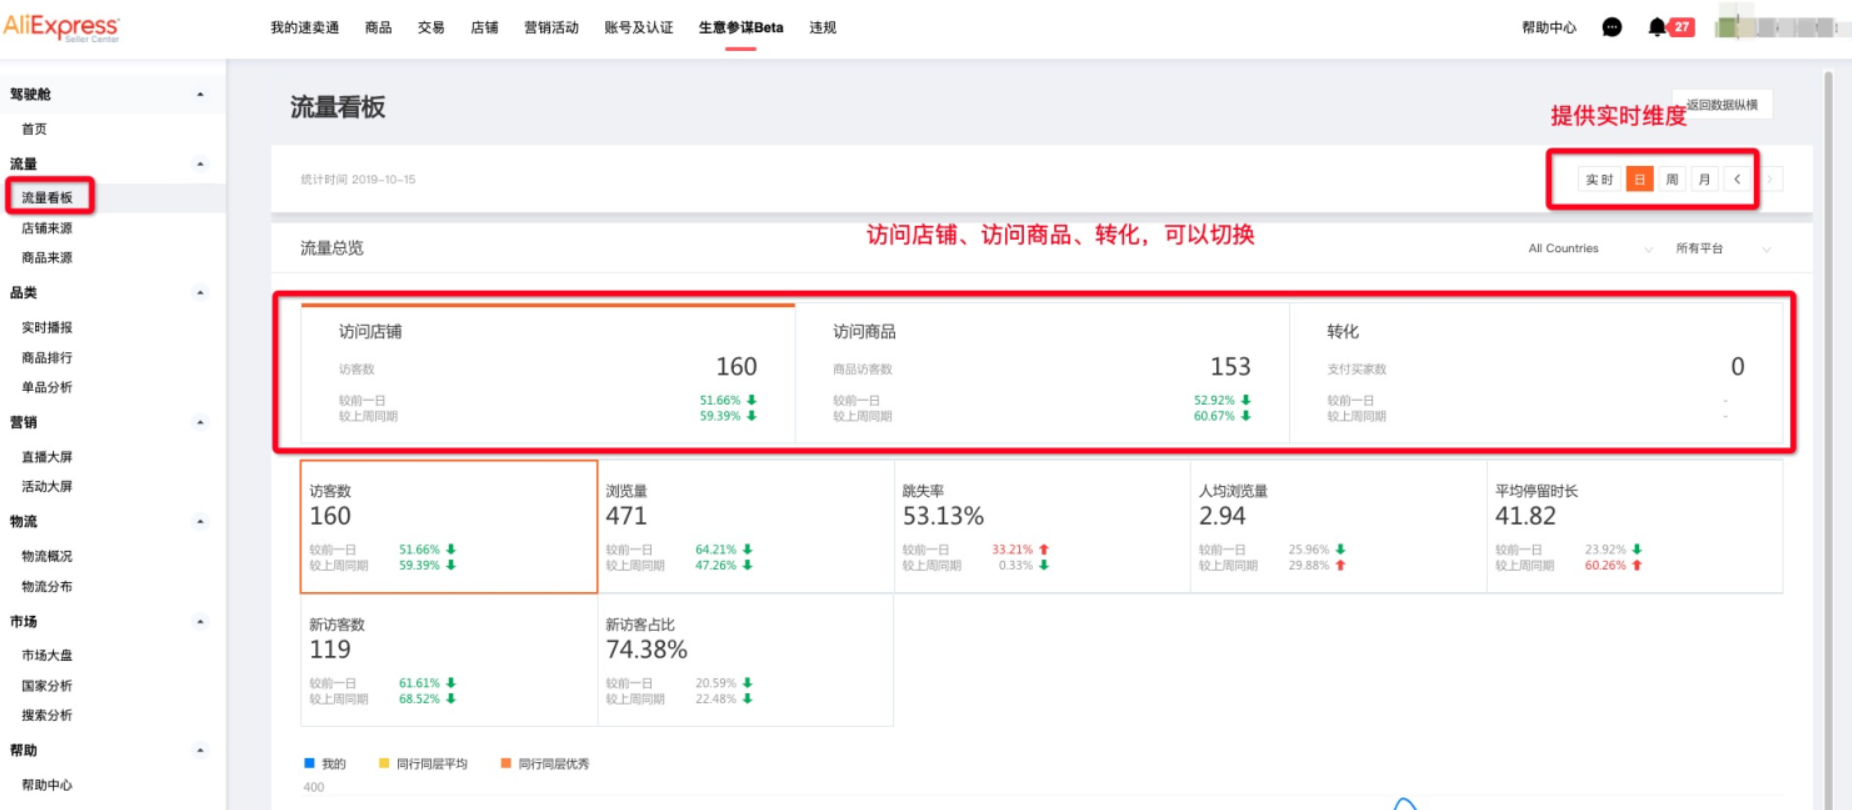
3.1 Traffic Kanban
Provide real-time dimensions.
You can switch to stores, goods, conversions.
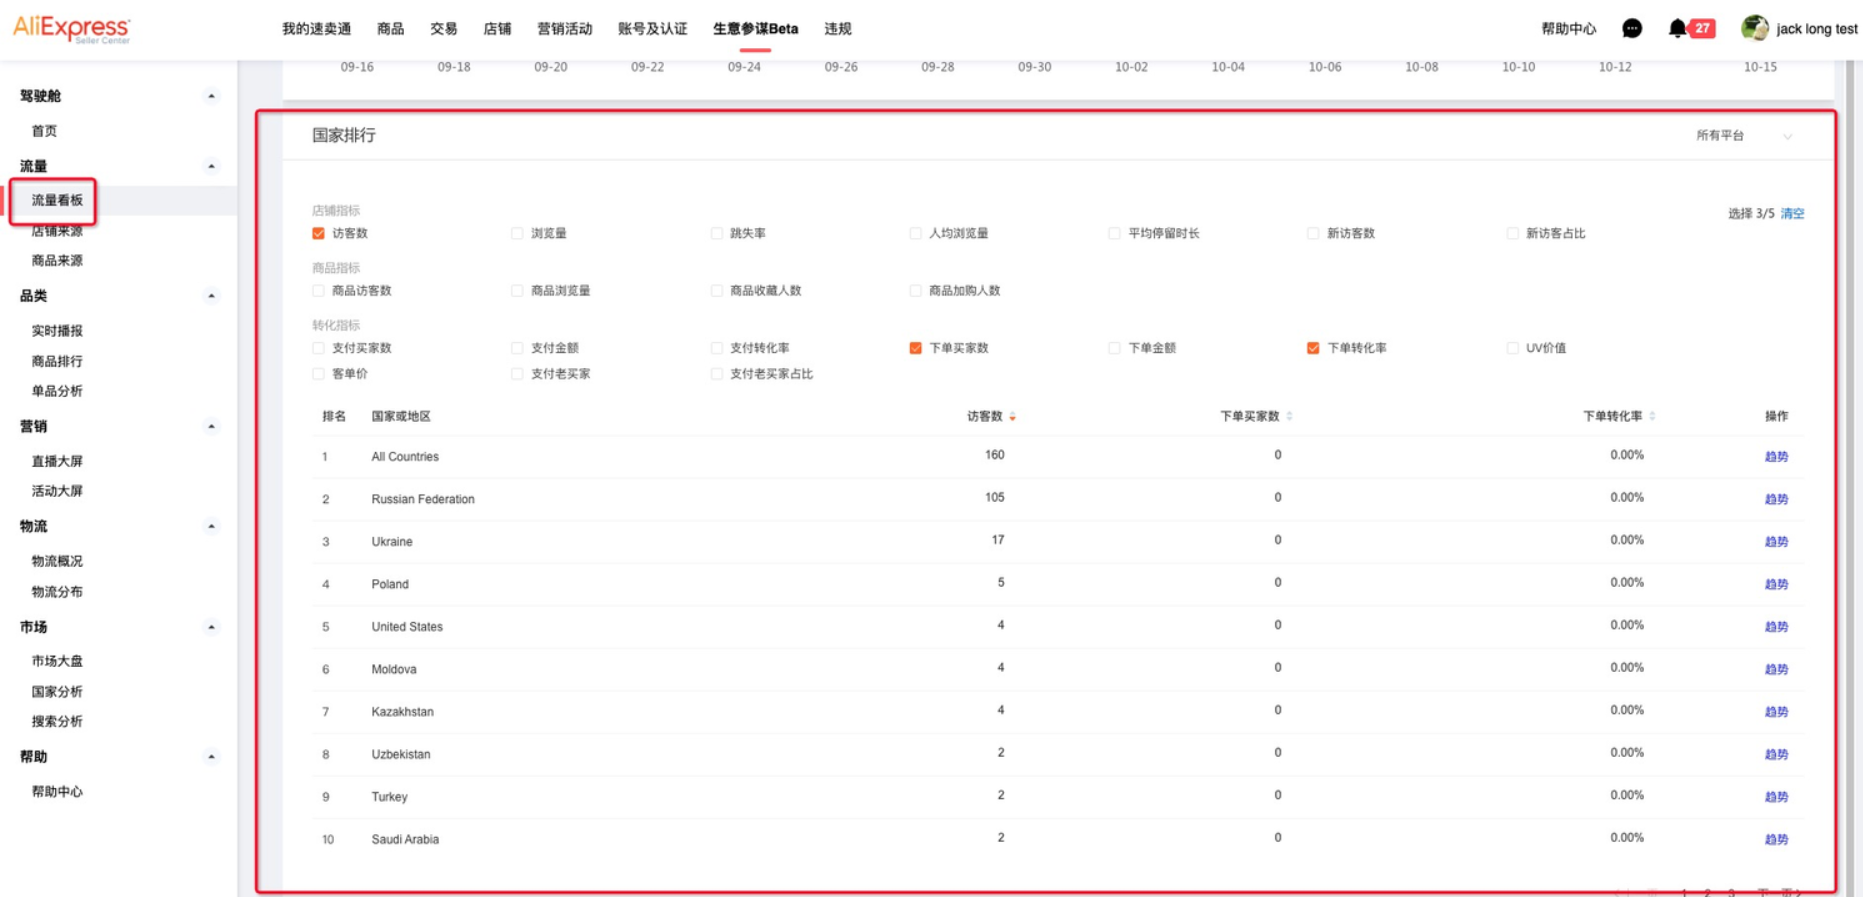
Provide national ranking function, including core indicators.
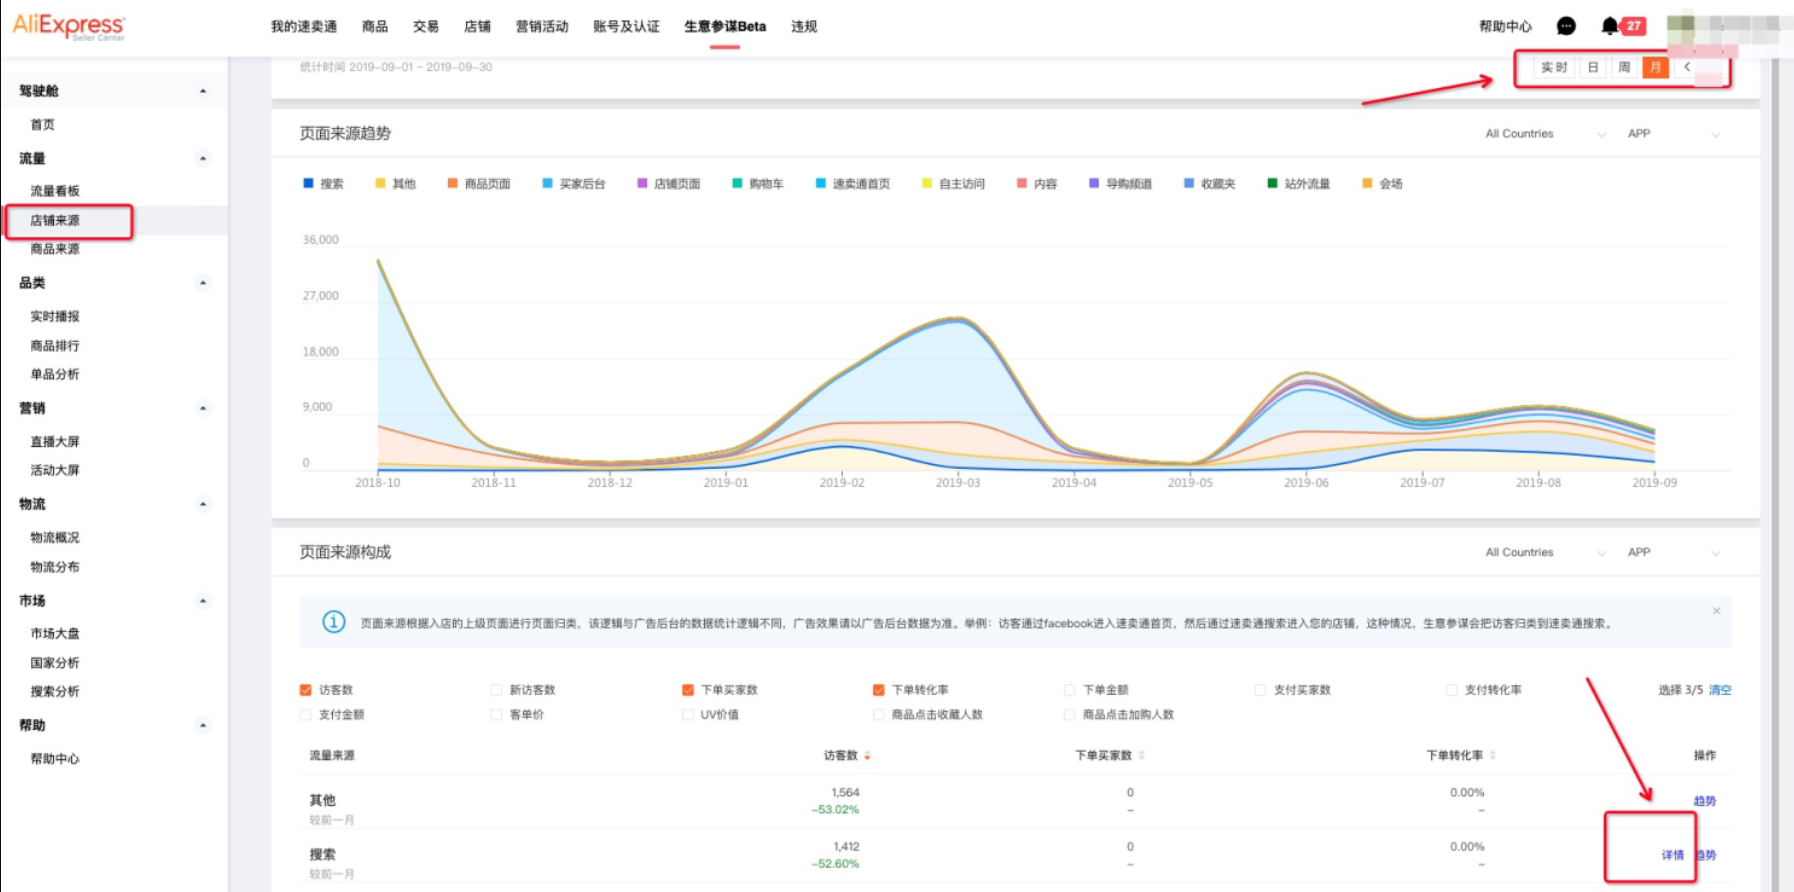
3.2 Store Source
Provide real-time dimensions to view the details of a source
3.3 Sources of commodities
Only goods that meet traffic and orders at the same time will appear in the ranking list of commodity source analysis. Click on the source of goods to view the flow source of a single commodity.
4. category
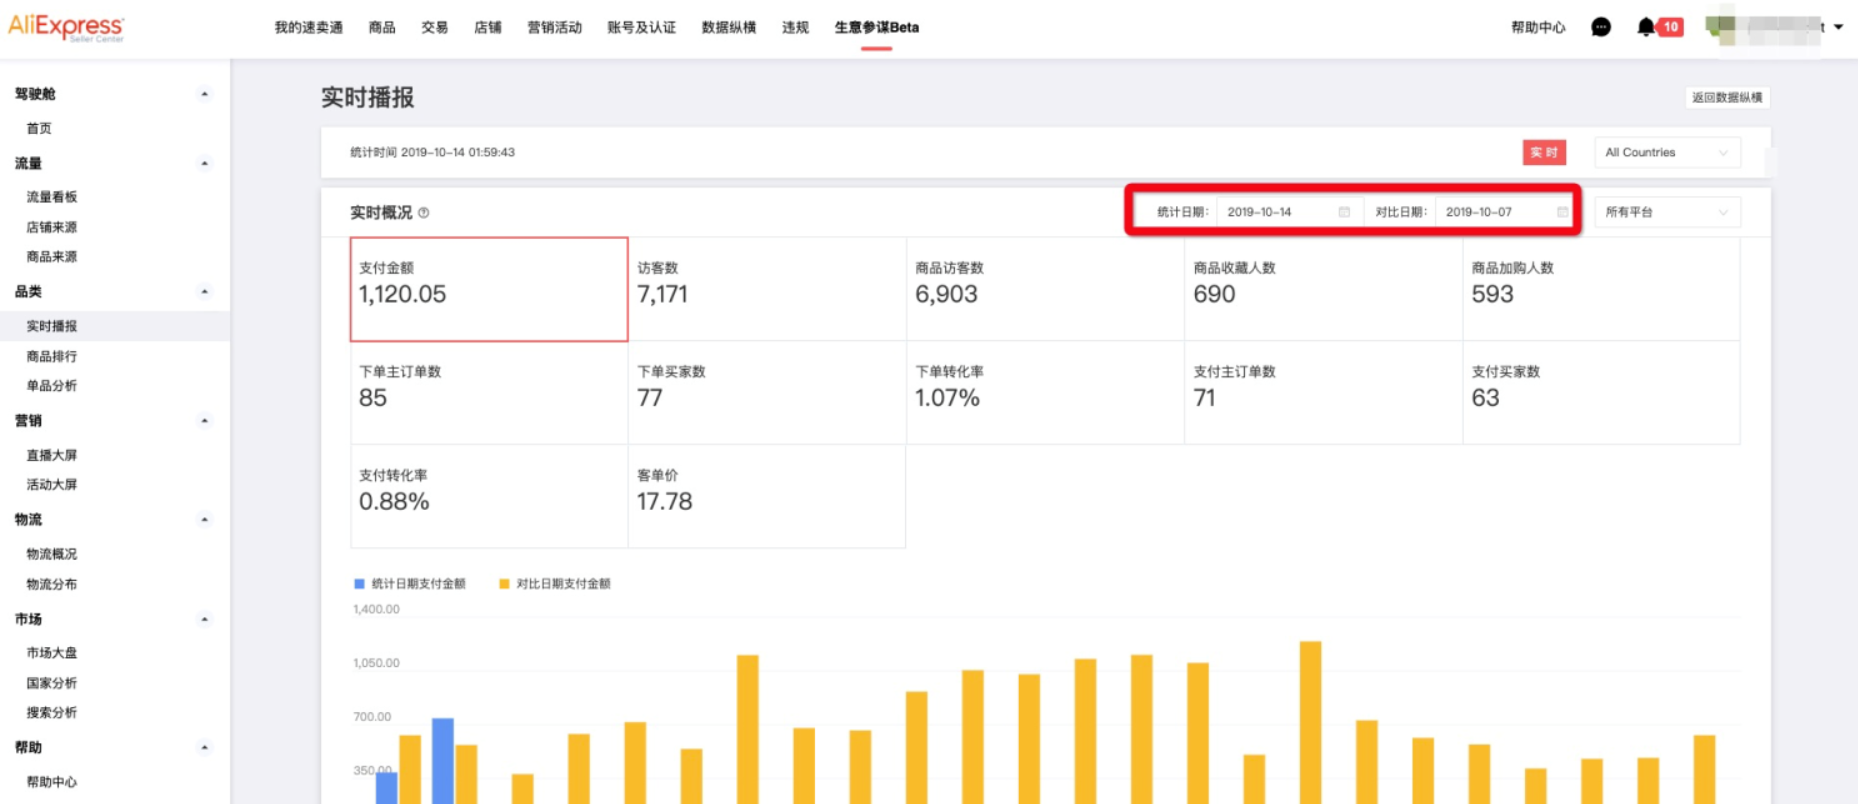
4.1 Real-time broadcast
4.1.1 Continue to provide the function of real-time comparison with historical data, but historical data only retains data for nearly 90 days. If you want to view more historical data, please go to the homepage of the business staff to view the daily, weekly and monthly data of the whole store.
Special note: Due to exchange rate problems, real-time data will have errors with offline data. Check the accurate data. It is recommended to refer to offline data.
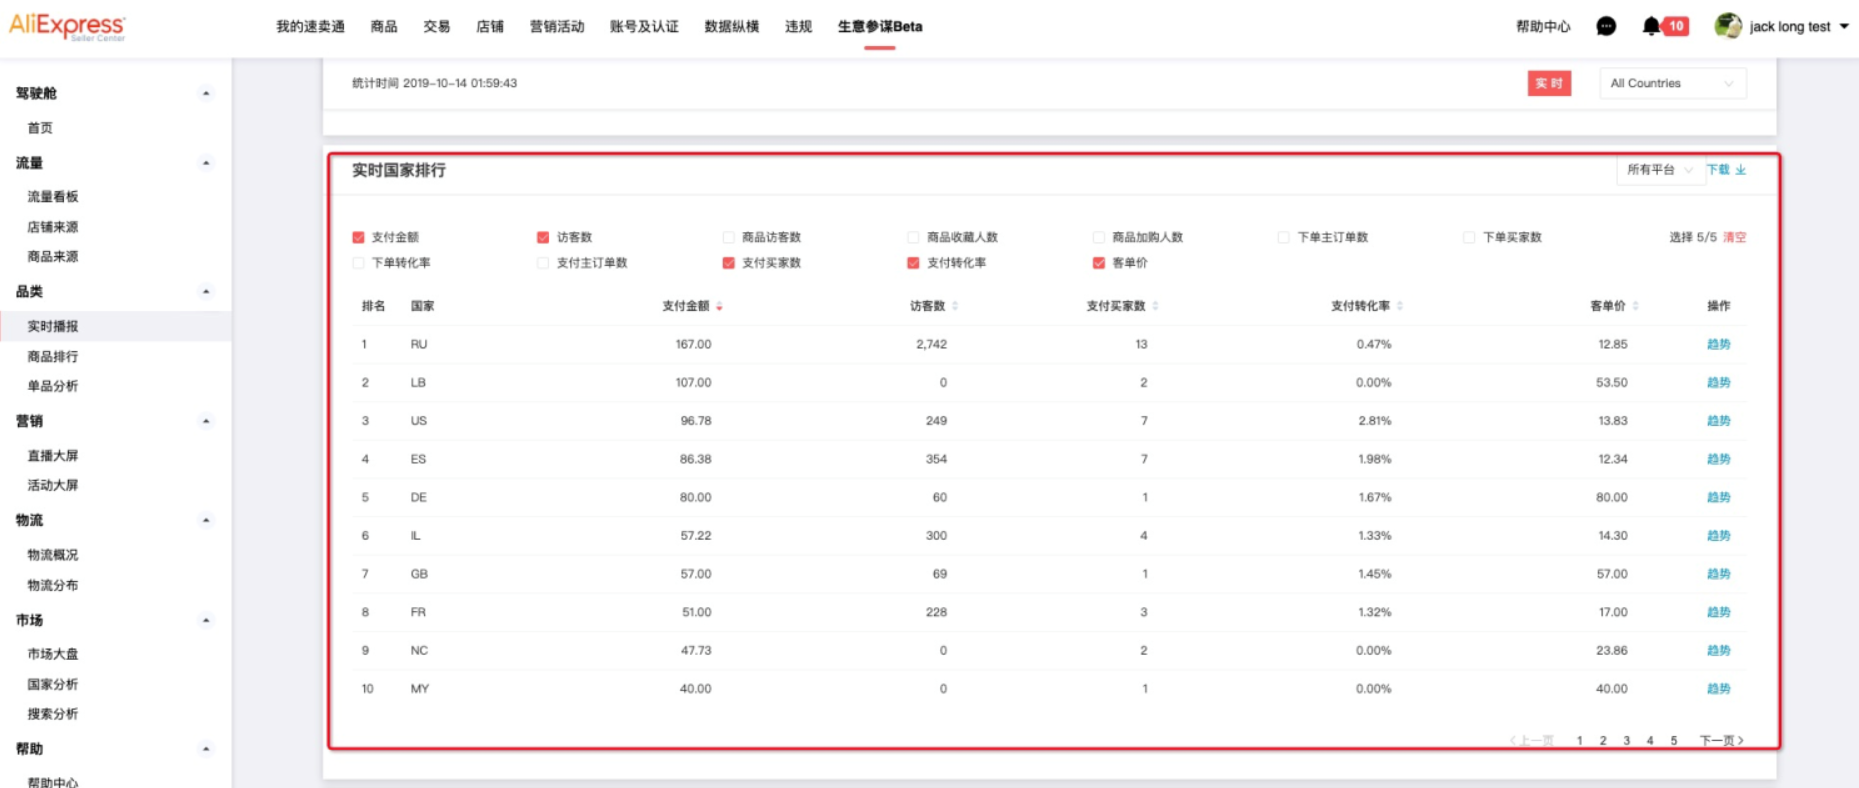
4.1.2 Increase the function of real-time national ranking compared with the horizontal and vertical data
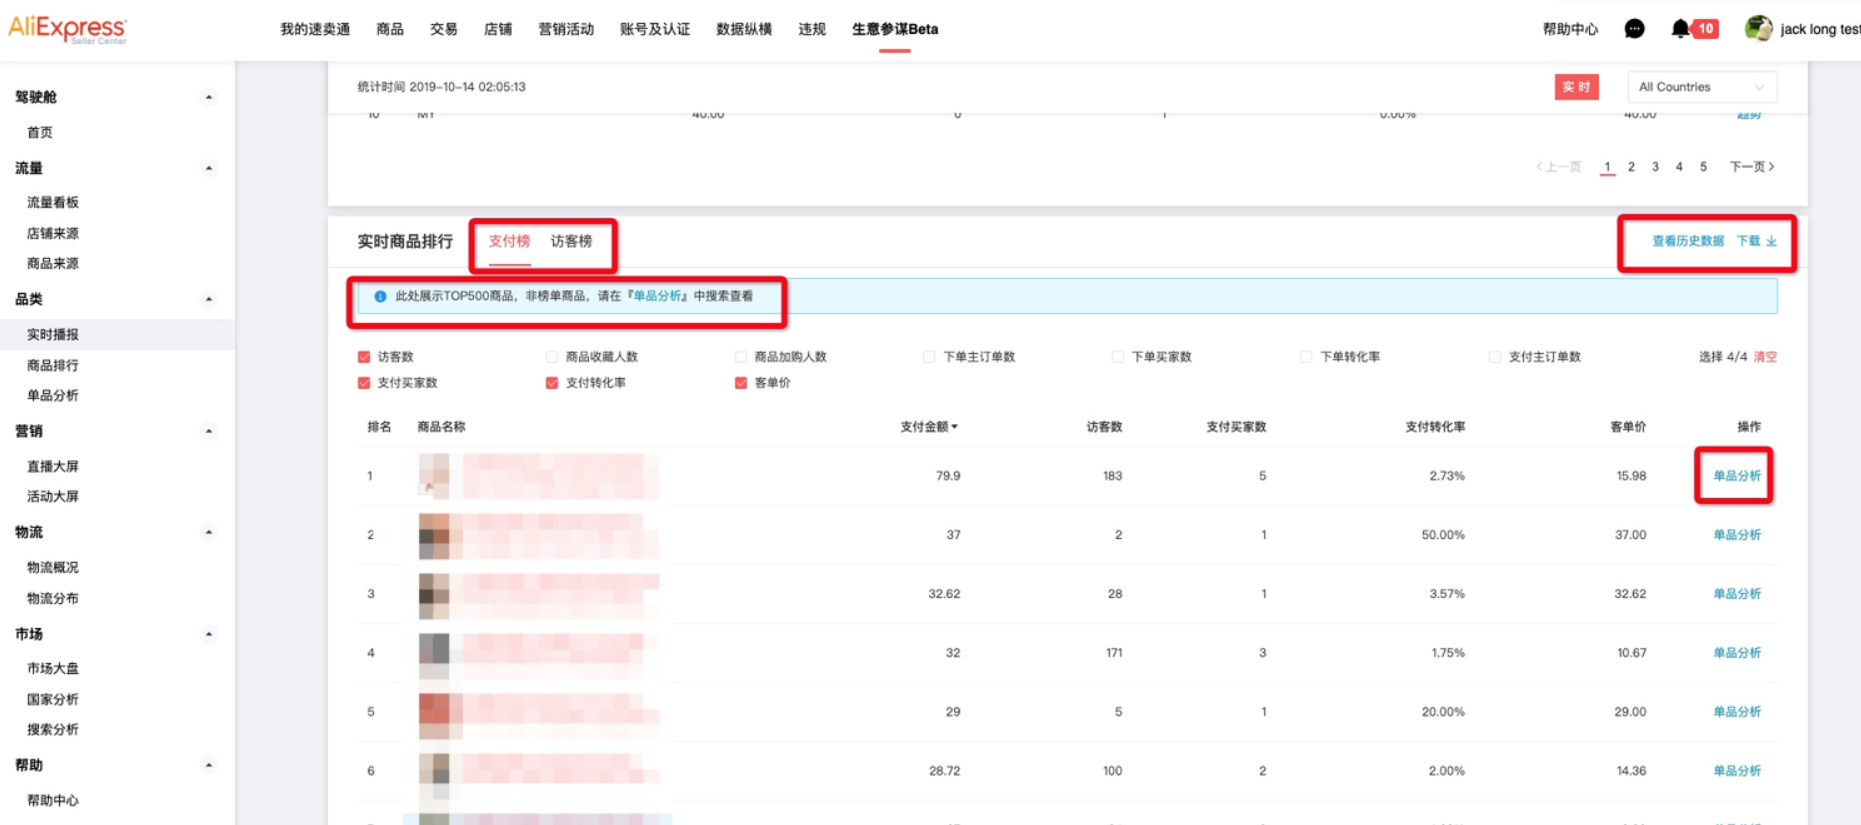
4.1.3 In order to provide more stable real-time data, provide payment list and visitor list TOPO500. To view real-time other commodity analysis, search and view the [single product analysis] menu. In the single product analysis, you can see the core indicators and trend chart of real-time goods.
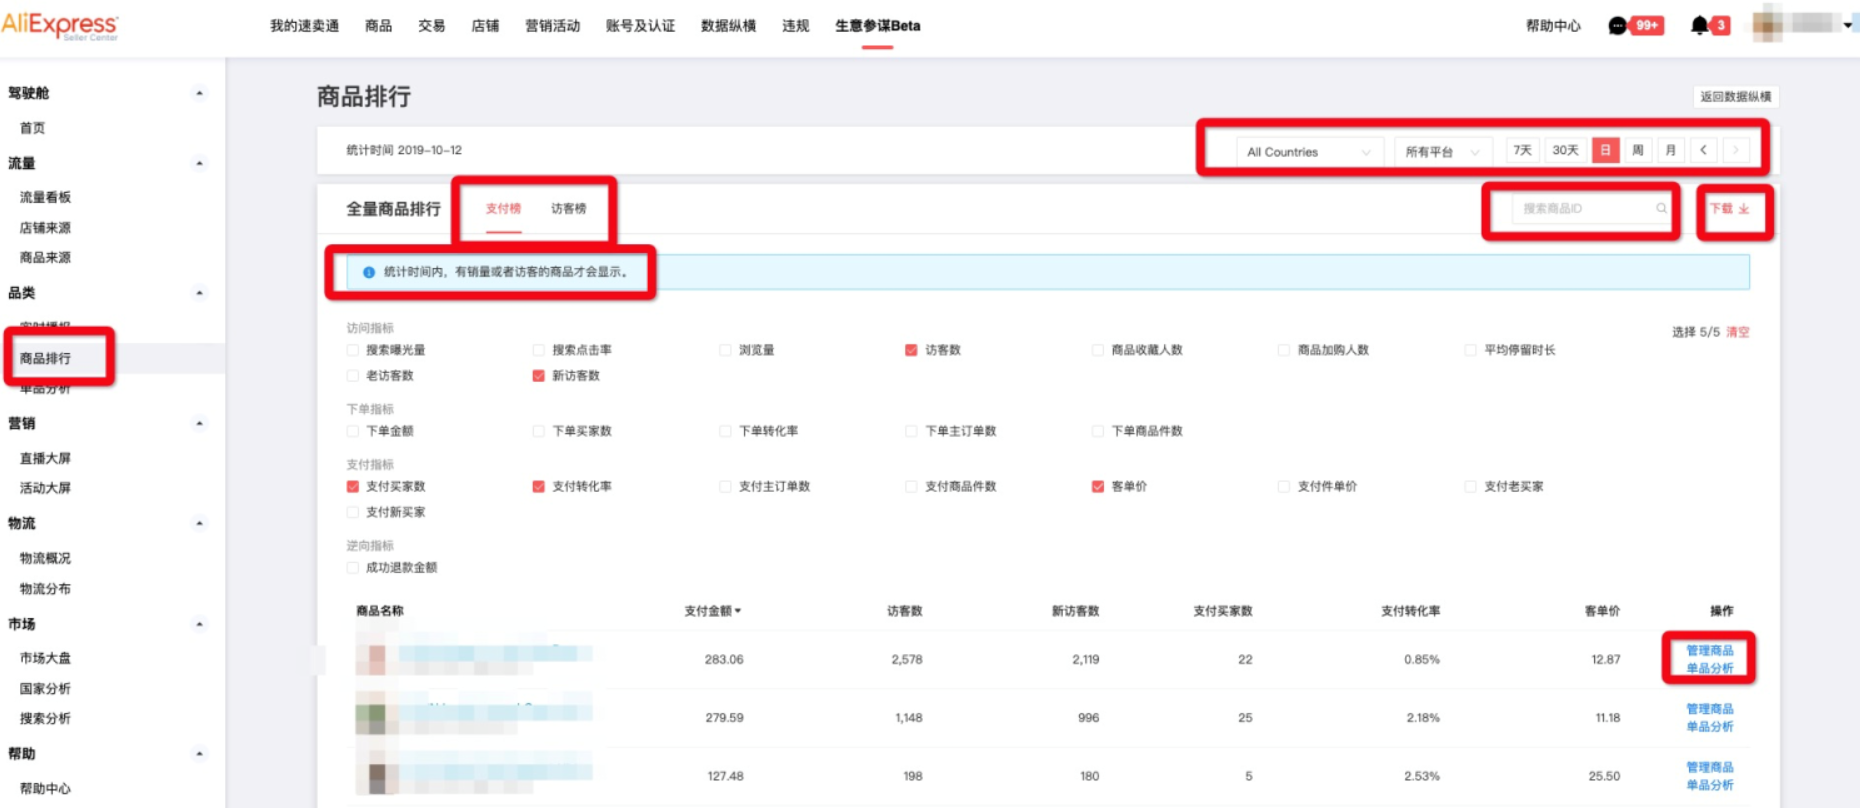
4.2 Commodity Ranking
4.2.1 Display offline product ranking (real-time product ranking is broadcast), provide all goods with sales or visitors within the selected time frame, and have a download function.
This is different from the data vertical and horizontal. The data vertical and horizontal data can only display products with search exposure TOP1000, and the national drop-down box is only 5 countries. Business staff shows all goods sold or traded, and there are 30 countries in the national drop-down box.
However, because the data volume of business poor staff goods + national dimensions is larger than that of data, the indicators of business staff cannot be manually sorted, so it has been made into two lists: payment list and visitor list.
4.2.2 You can jump into [Single Product Analysis] to view the trend chart and SKU analysis of single product.
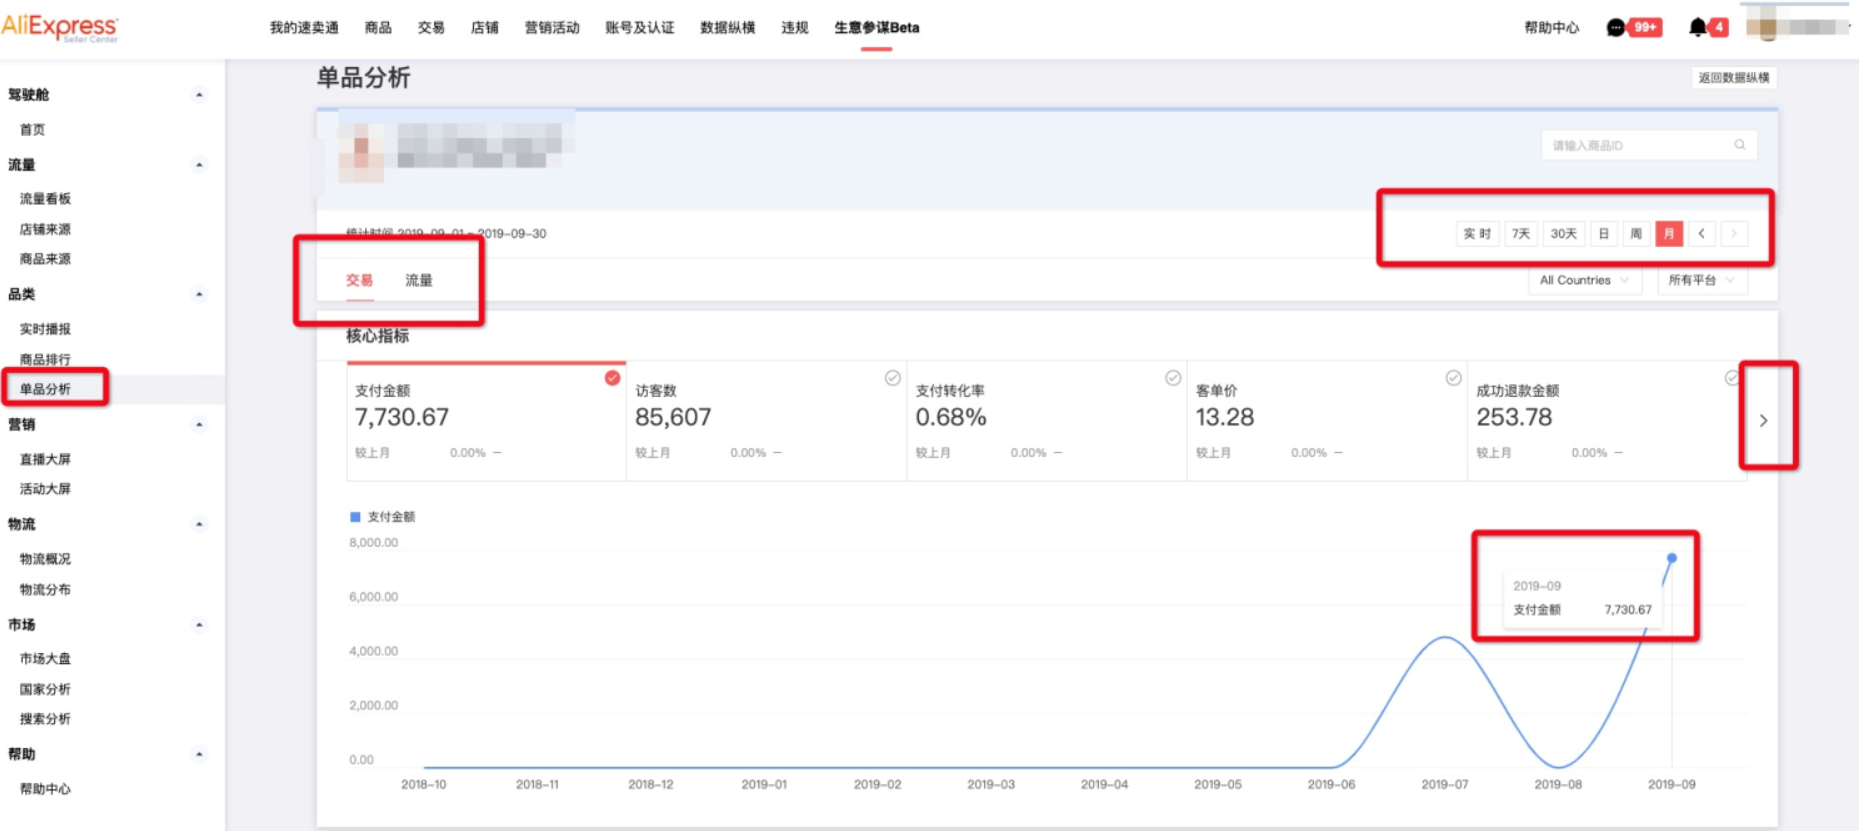
4.3 Single product analysis
4.3.1 Enter the analysis of a single product by searching for the product ID, or enter the [single product analysis] through the [commodity ranking] menu.

4.3.2 Provide real-time, daily, weekly and monthly time dimensions data and trend charts
Note: Weekly and monthly data are still being supplemented. At present, only the data of the recent period can be seen.
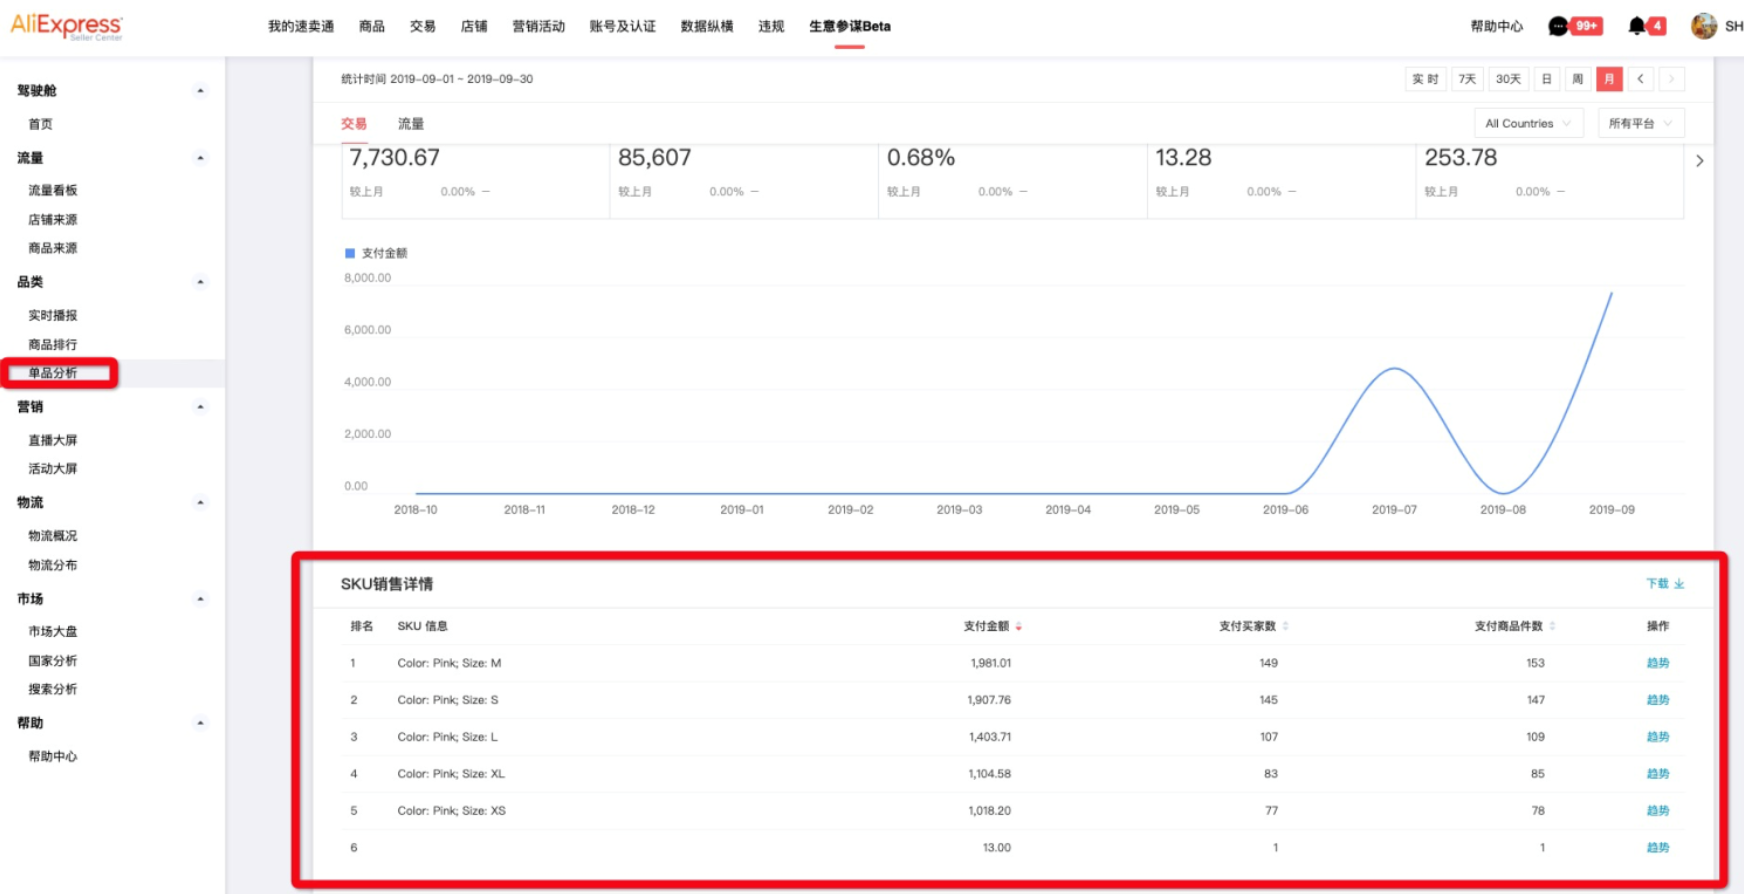
4.3.3 Provide SKU analysis of commodities
5. marketing
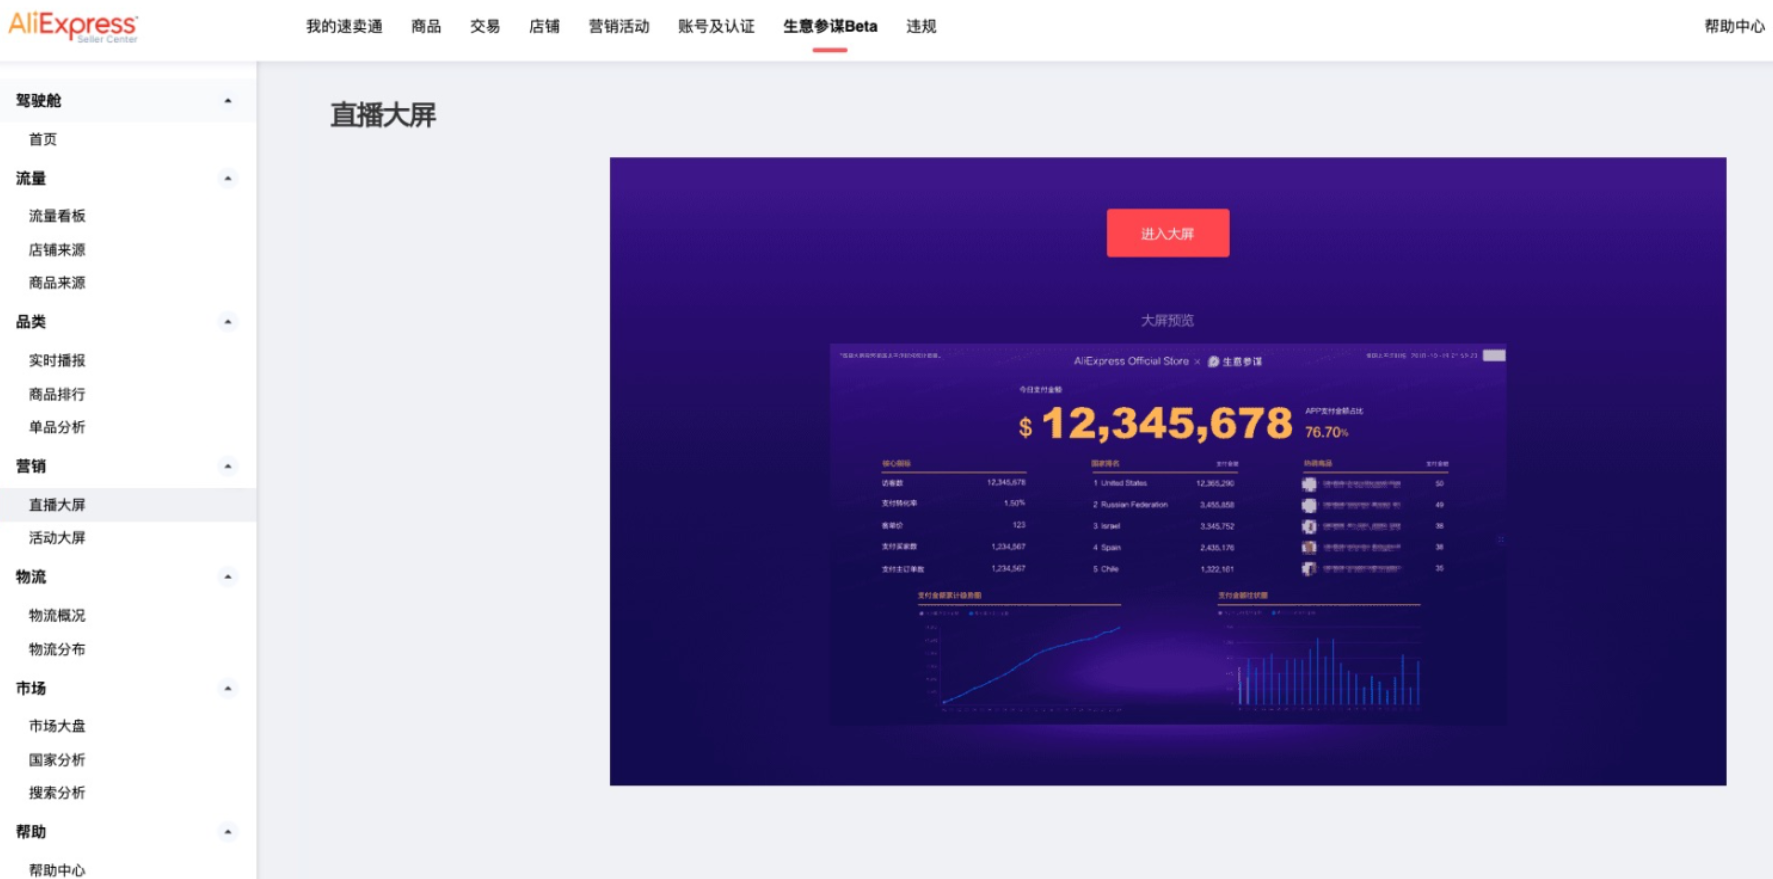
5.1 Large Live Screen
At present, only some merchants have randomly opened large-screen permissions for live broadcast. When merchants accumulate transactions to a certain extent, they will enter the queue of live broadcast opening.
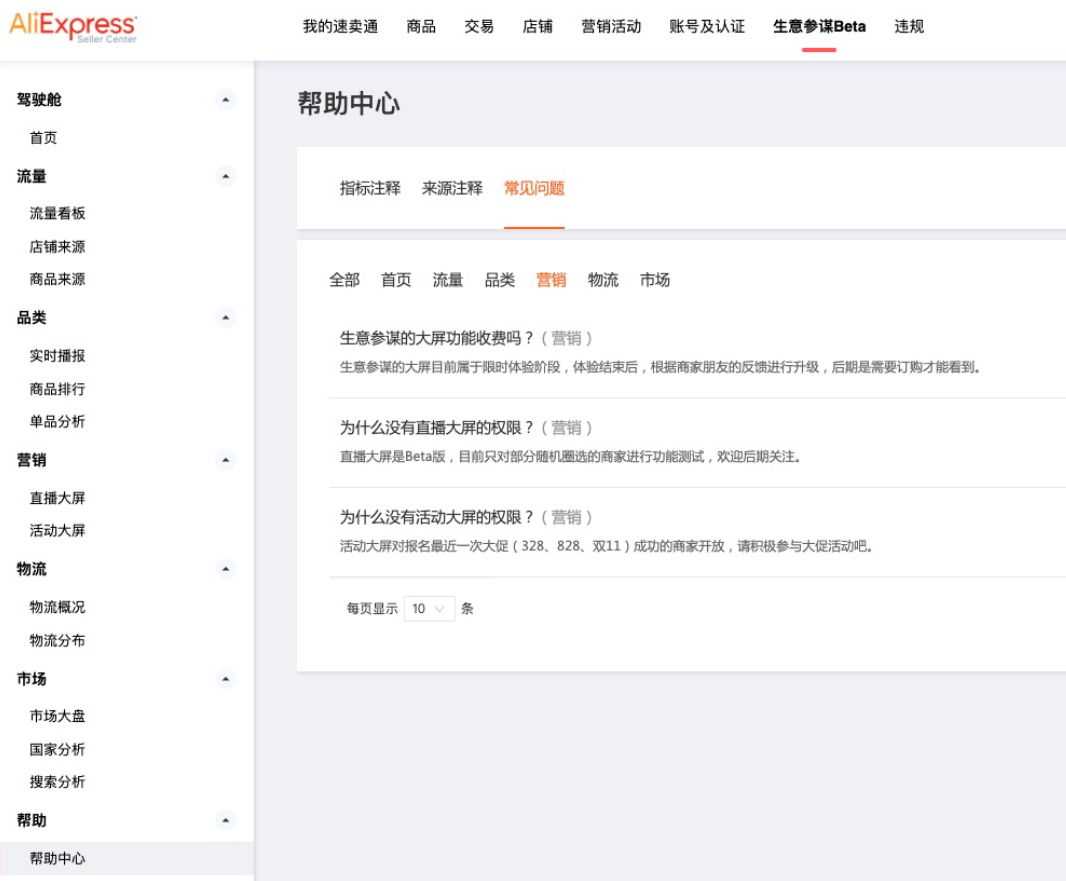
5.2 Large activity screen
The large screen of the activity is open to merchants who have successfully signed up for the latest promotion (328, 828, Double Eleven). Please actively participate in the promotion.
5.3 The help center has instructions for the large screen
6. logistics
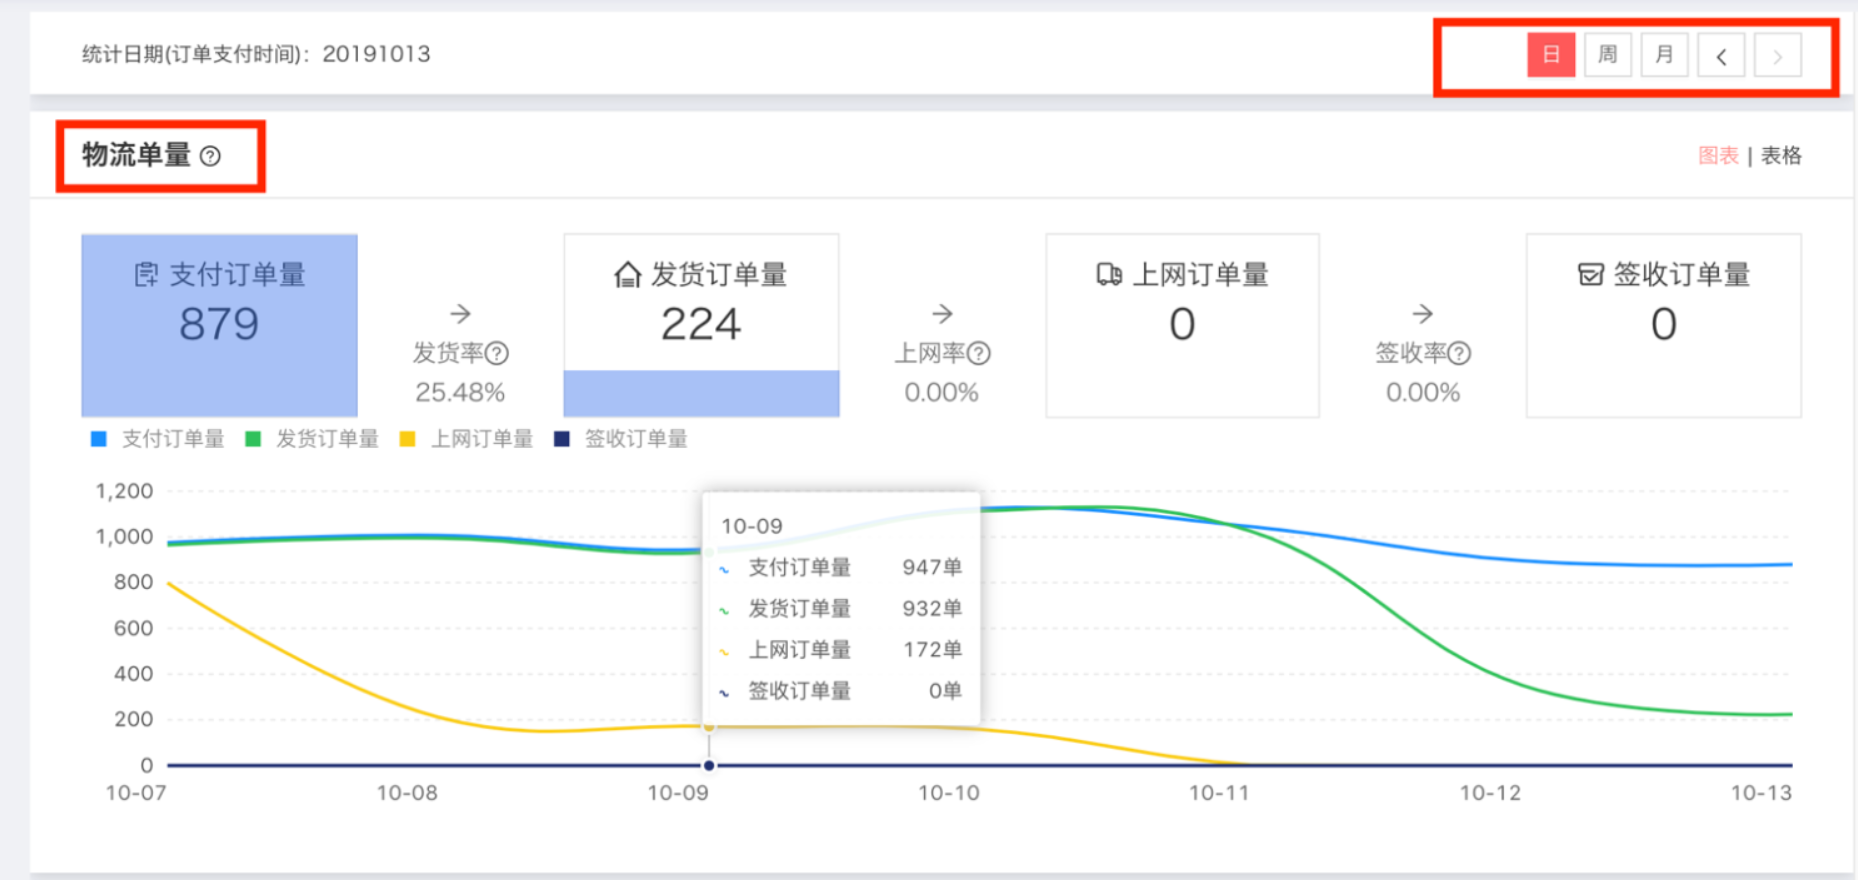
6.1 Logistics Overview
6.1.1 According to the selected date, give the latest logistics performance of the corresponding order, including four main links: payment volume, delivery volume, Internet access volume and signature volume. At the same time, it provides data filtering and trend charts for daily, weekly and monthly time dimensions.
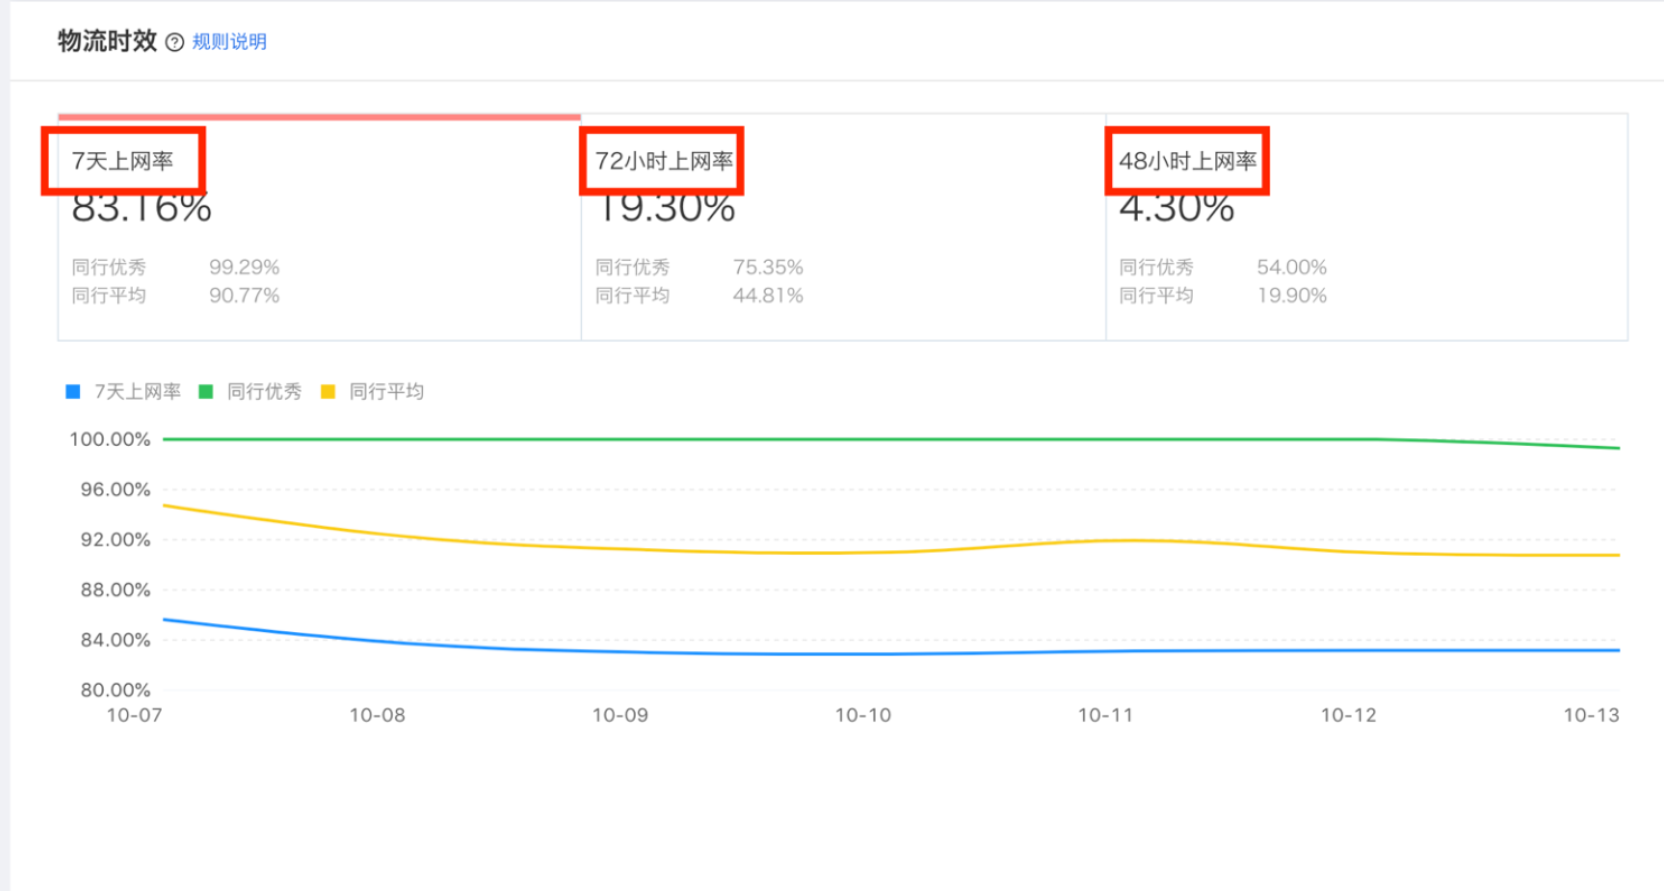
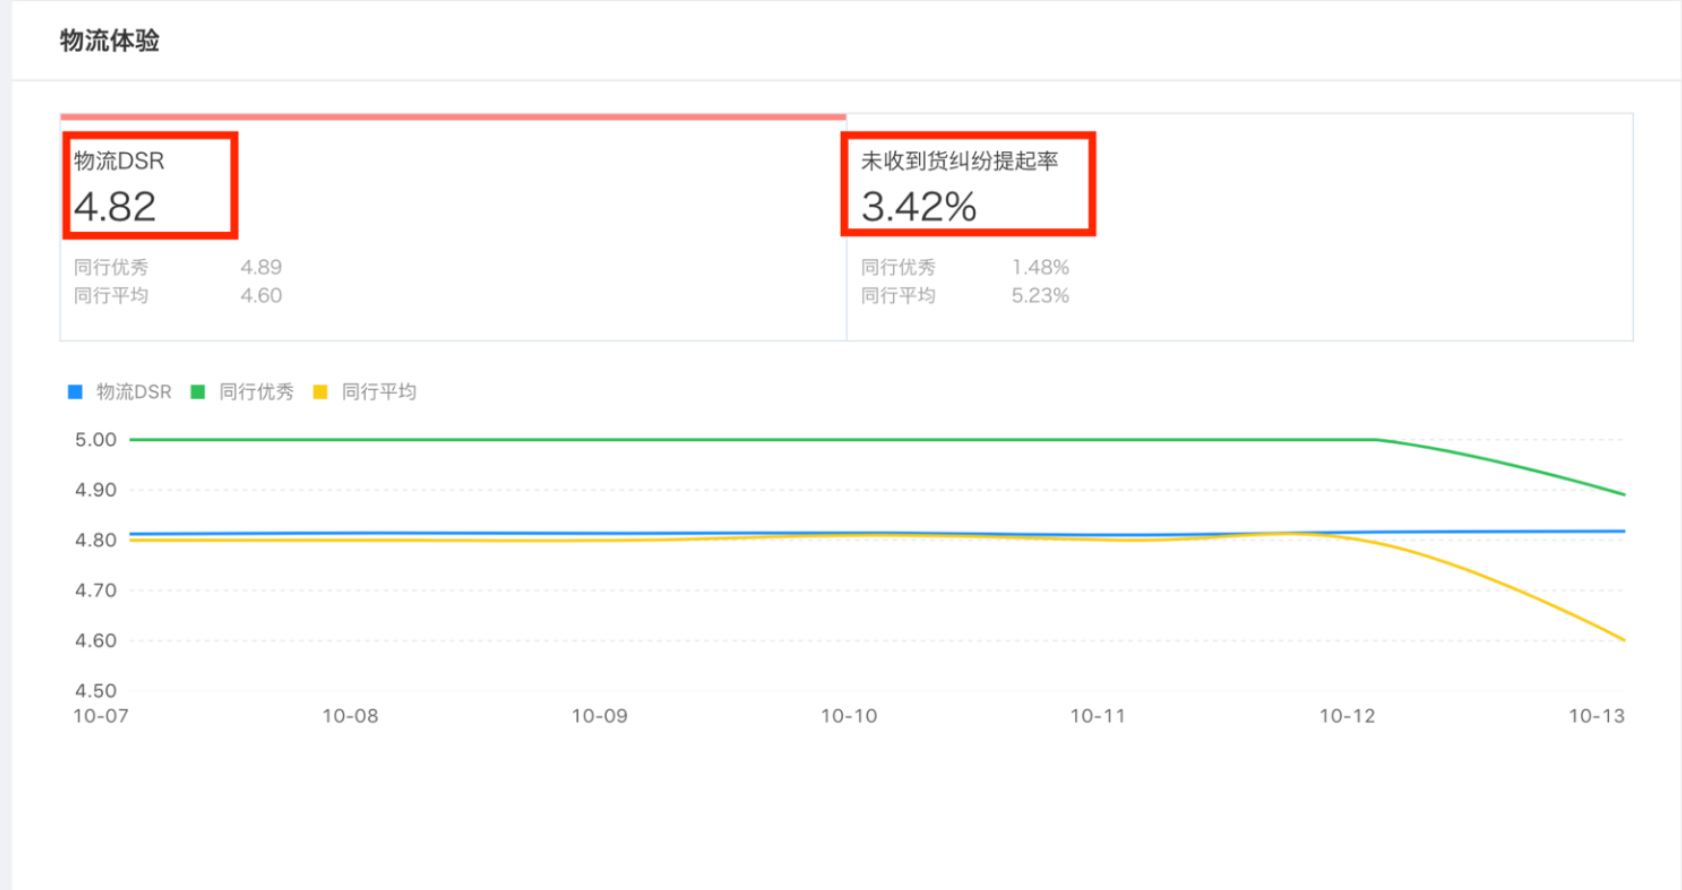
6.1.2 According to the front desk assessment indicators, give the performance of the store and the excellent and average level of the same industry (the main store in the second-level category). It mainly includes three Internet access indicators, 7 days/72 hours/48 hours Internet access, and two experience indicators: logistics DSR, and failure to receive goods disputes.
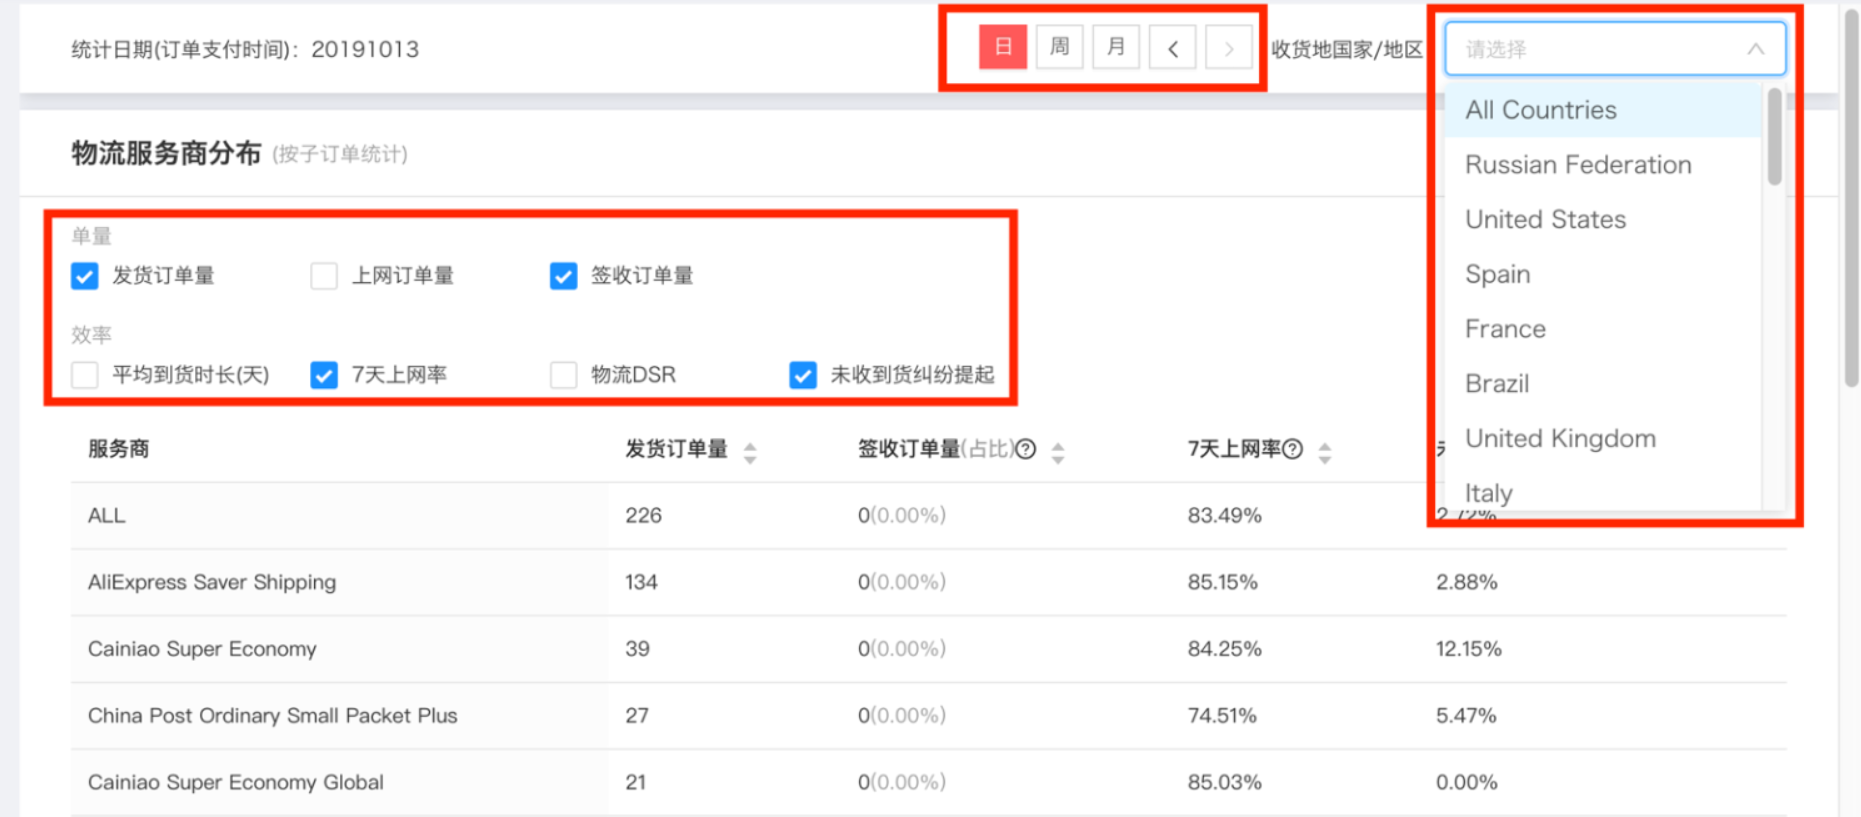
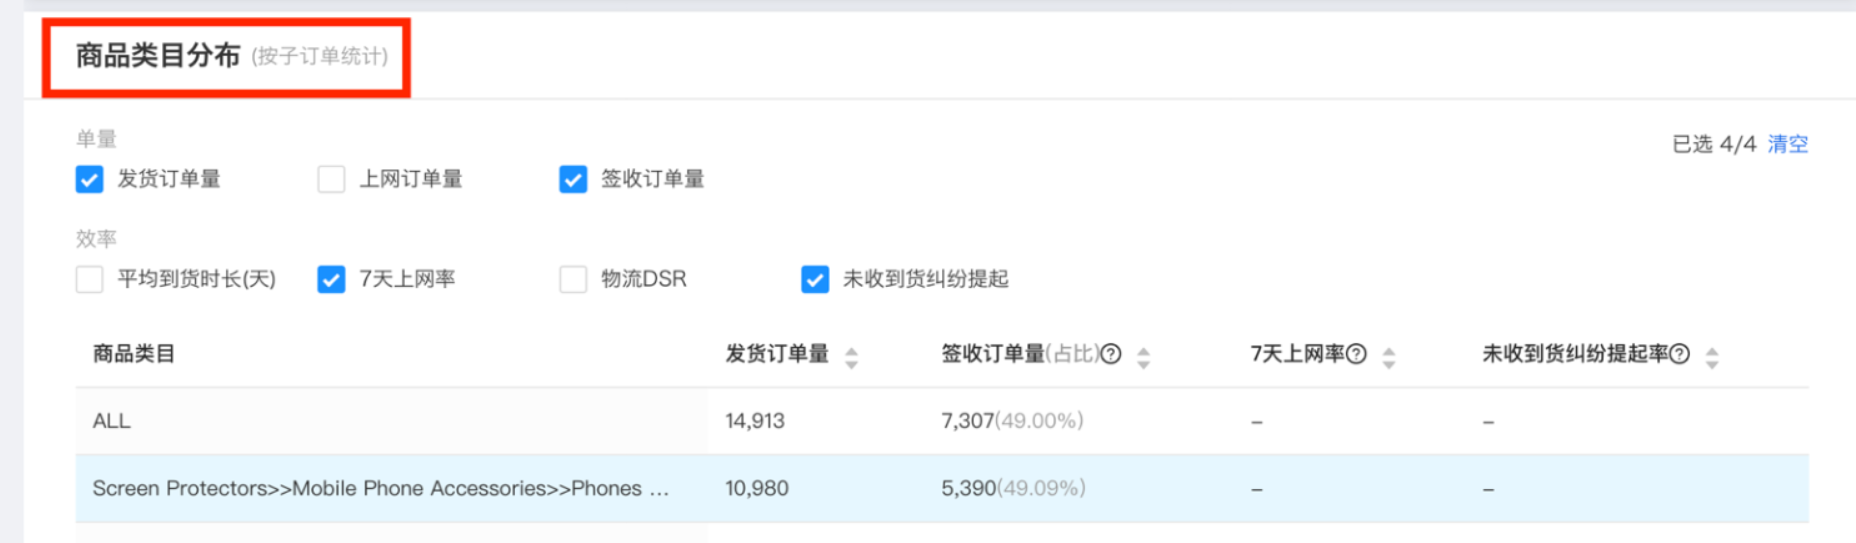
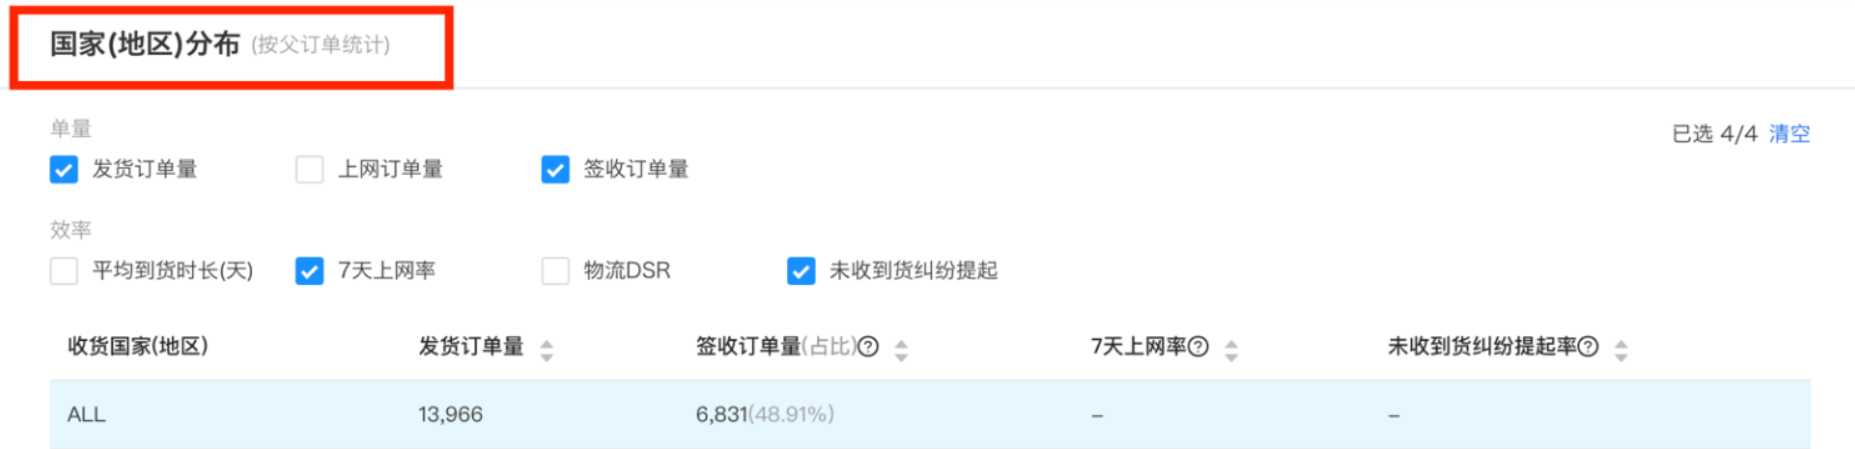
6.2 Logistics Distribution
6.2.1 Provide data screening for daily, weekly and monthly time dimensions, and also provide data screening for 30 major receiving country (region) dimensions.
6.2.2 The performance of each indicator can be seen from the three dimensions of logistics service providers, commodity categories and the country (region) where the goods are received. Due to the rich dimensions and large amount of data, the current daily data is only open for the last two weeks, but the weekly and monthly data can be seen for nearly six months.
7. market
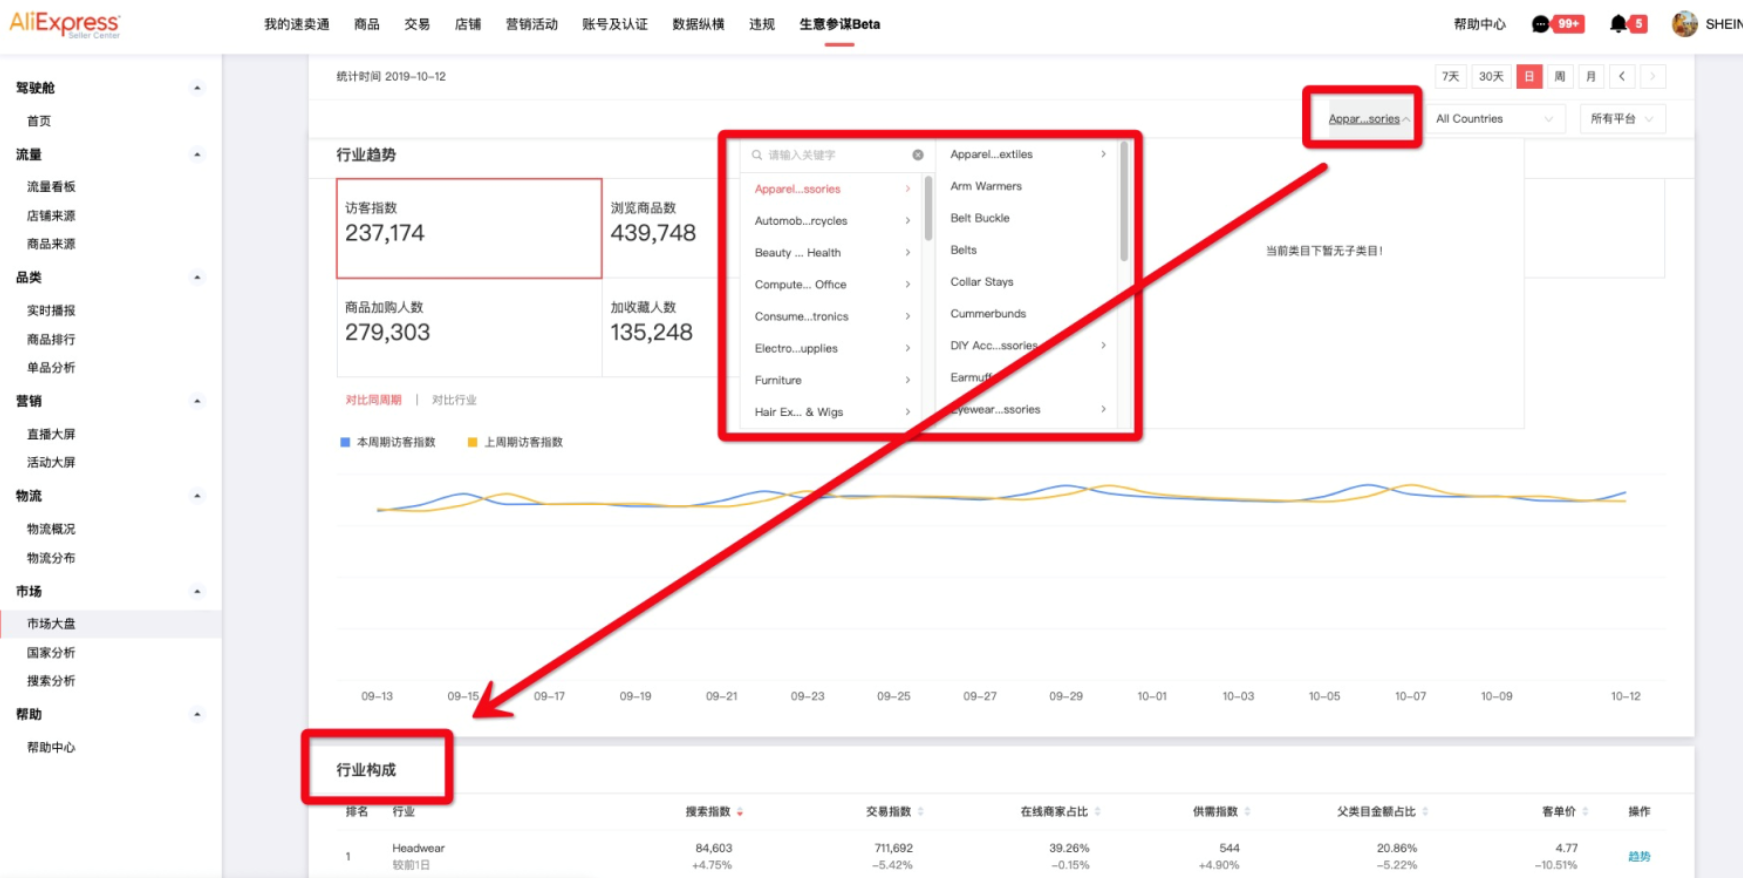
7.1 Market Market
Only when you choose a non-leaf industry can there be the [industry composition] module, because the industry composition shows the sub-industry of the selected industry.
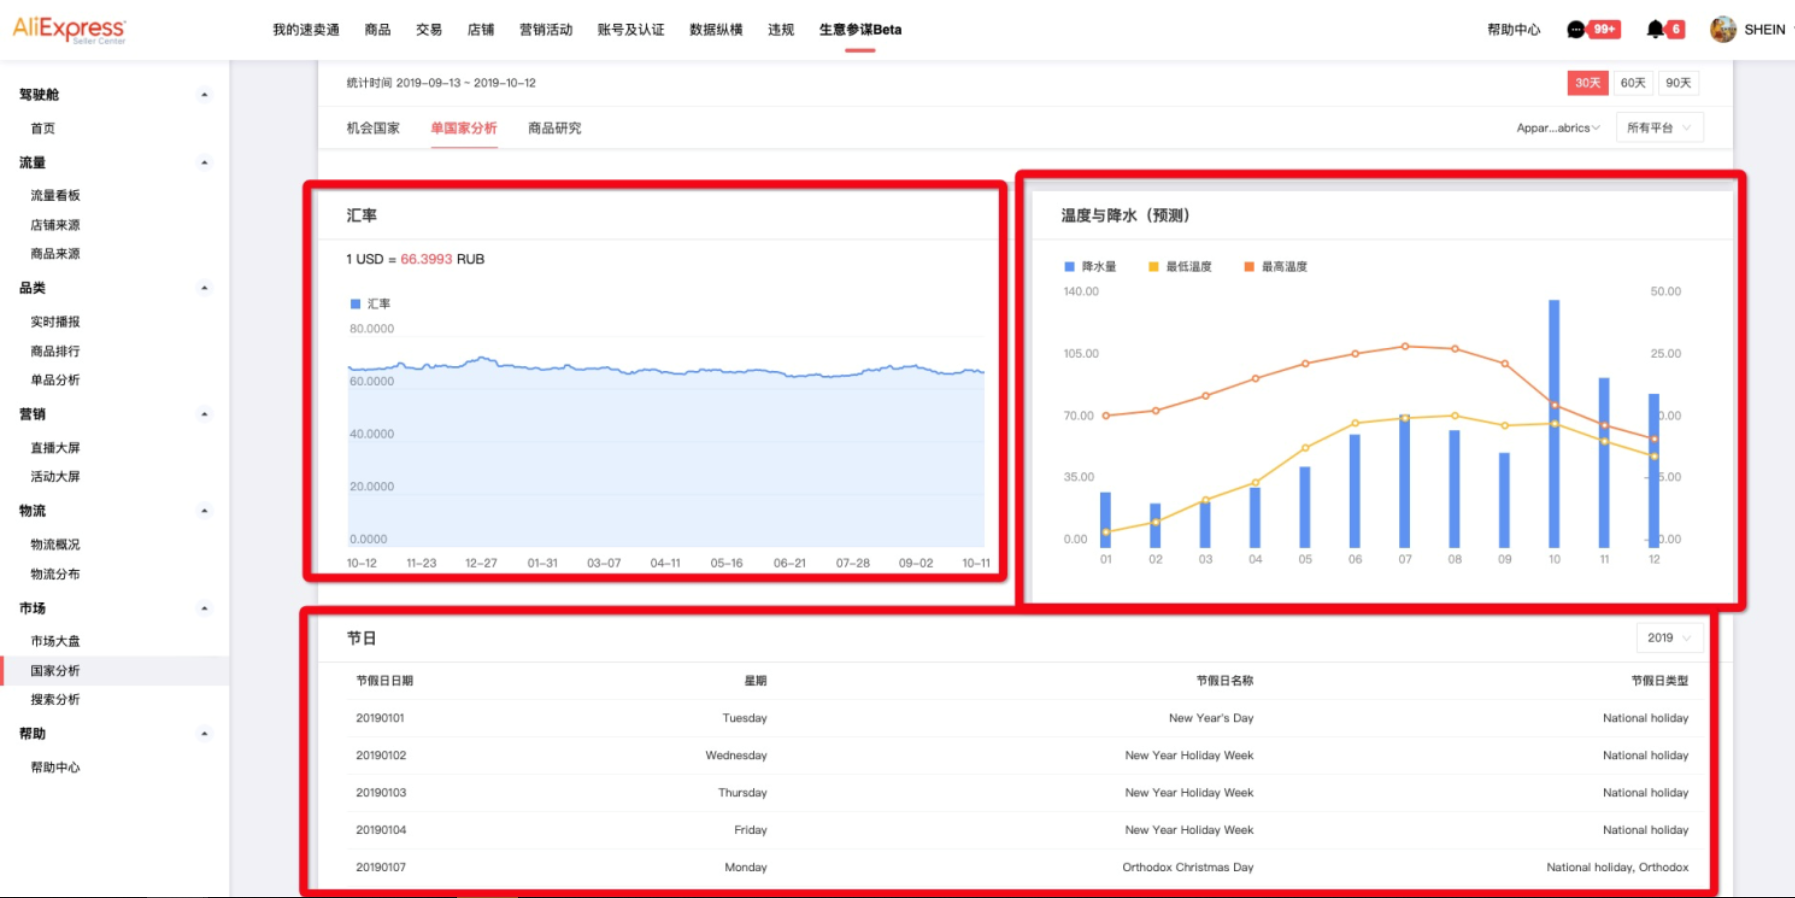
7.2 Country analysis
Provide a country's exchange rate, temperature and precipitation, holiday data
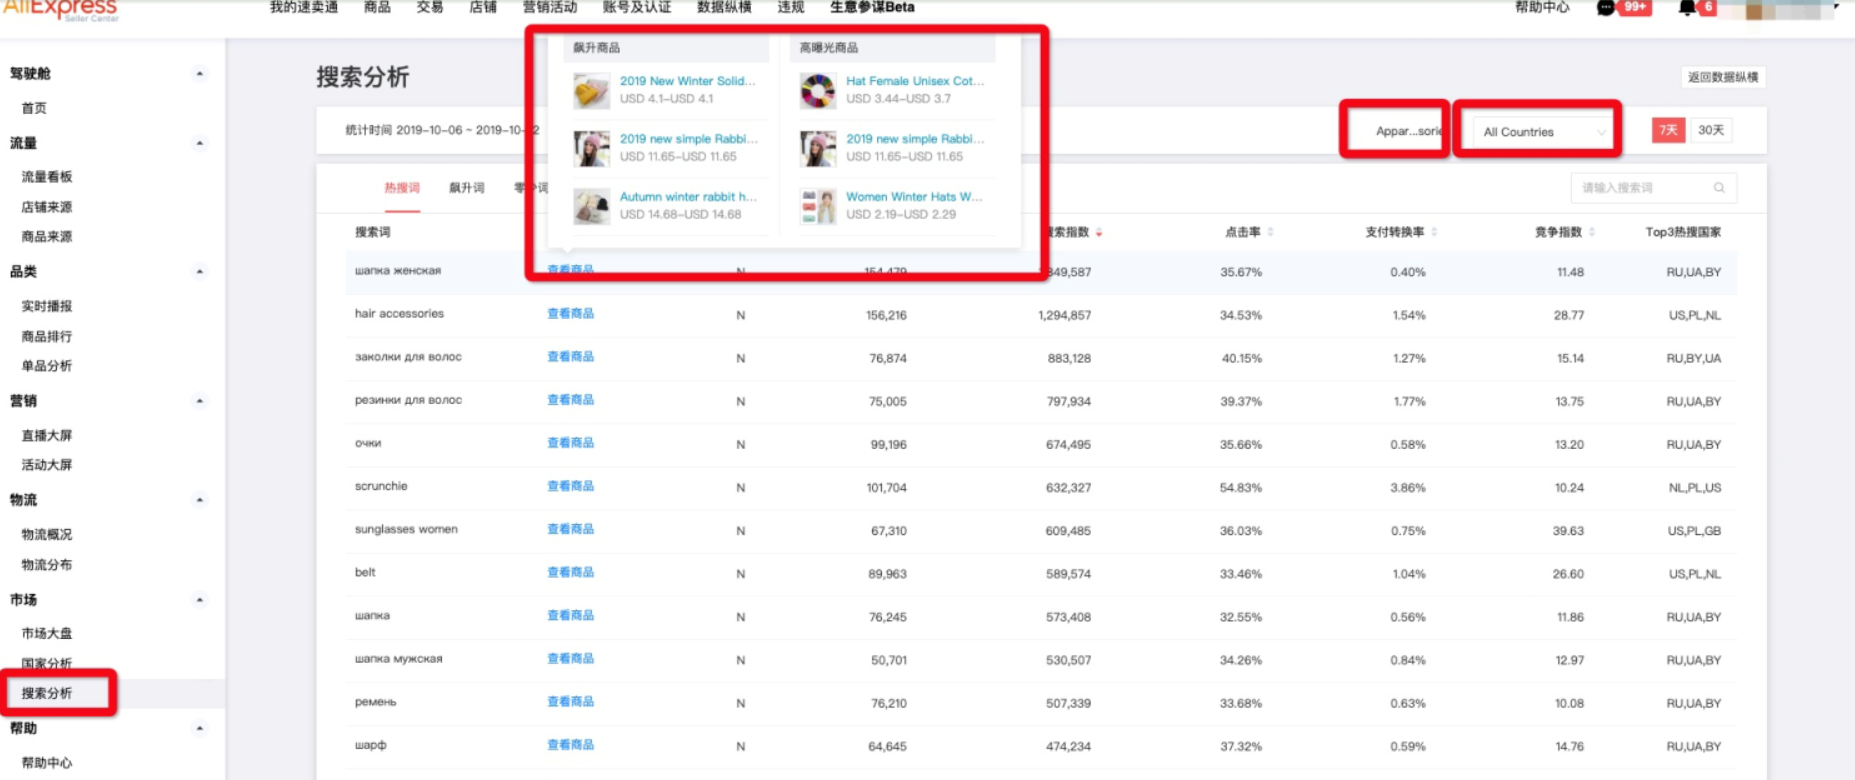
7.3 Search Analysis
7.3.1 The category drop-down box selects the leaf category of the first category by default. When the default category data is too little, just switch the category to view.
7.3.2 There are only 11 countries in the drop-down box of horizontal and horizontal countries, and 30 priority countries are provided by business staff officers.
7.3.3 Due to the increase in data from 19 countries and the large amount of data, the [View Goods] module can only have 3 soaring and 3 high-exposure goods.
Note: When there is no data on the viewing goods, just switch categories to view. Under certain categories, it is eligible for high-exposure and soaring goods.
8. help
The help center has detailed indicator comments, source comments, and frequently asked questions. You can check it by yourself.

9. other
9.1 Announcement
When the data is delayed and the new functions are online, an announcement will be issued. The announcement is at the top of the page. You can click the fork to close the announcement.

- Get link
- X
- Other Apps
- Get link
- X
- Other Apps
Comments
Post a Comment